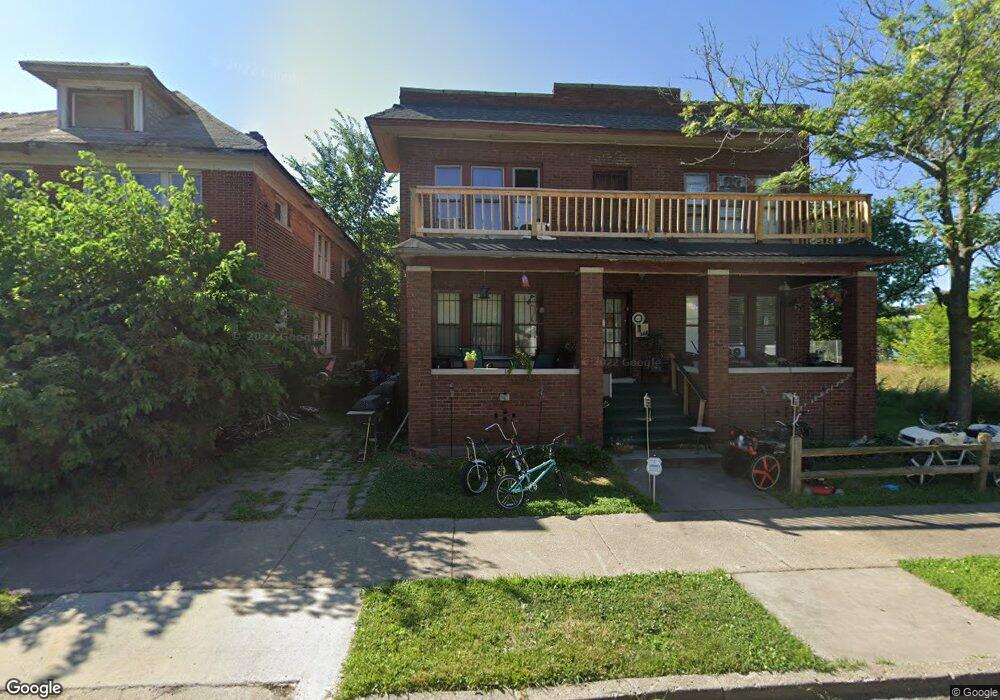
311 W Buena Vista St Highland Park, MI 48203
Estimated Value: $158,000 - $206,000
6
Beds
4
Baths
3,876
Sq Ft
$48/Sq Ft
Est. Value
About This Home
This home is located at 311 W Buena Vista St, Highland Park, MI 48203 and is currently estimated at $186,251, approximately $48 per square foot. 311 W Buena Vista St is a home located in Wayne County with nearby schools including Barber Elementary School, George Washington Carver Elementary School, and New Paradigm Glazer Academy.
Ownership History
Date
Name
Owned For
Owner Type
Purchase Details
Closed on
Nov 16, 2017
Sold by
Sabree Eric R
Bought by
Mounmental Property Management Group Llc
Current Estimated Value
Purchase Details
Closed on
Nov 11, 2014
Sold by
Treasurer Of The Charter County Of Wayne
Bought by
Siberian Llc and The Buena Vista Trust
Purchase Details
Closed on
Oct 12, 2010
Sold by
Hazel Adrienne
Bought by
Bruce Cook Llc
Purchase Details
Closed on
Jul 16, 2007
Sold by
Household Finance Corp Iii
Bought by
Hazel Adrienne
Purchase Details
Closed on
Jun 13, 2007
Sold by
Mortgage Electronic Registration Systems
Bought by
Household Finance Corp Iii
Purchase Details
Closed on
Jan 5, 2006
Sold by
Johnson Florene and Hayes Samuel L
Bought by
Mortgage Electronic Registration Systems
Purchase Details
Closed on
Dec 2, 1999
Sold by
S L Hayes & Assoc
Bought by
Johnson Florene Johnson
Create a Home Valuation Report for This Property
The Home Valuation Report is an in-depth analysis detailing your home's value as well as a comparison with similar homes in the area
Home Values in the Area
Average Home Value in this Area
Purchase History
| Date | Buyer | Sale Price | Title Company |
|---|---|---|---|
| Mounmental Property Management Group Llc | $7,800 | None Available | |
| Siberian Llc | $9,100 | None Available | |
| Bruce Cook Llc | $18,000 | None Available | |
| Hazel Adrienne | $17,000 | Attorneys Title Agency Llc | |
| Household Finance Corp Iii | -- | Attorneys Title Agency | |
| Mortgage Electronic Registration Systems | $94,065 | None Available | |
| Johnson Florene Johnson | -- | -- |
Source: Public Records
Tax History Compared to Growth
Tax History
| Year | Tax Paid | Tax Assessment Tax Assessment Total Assessment is a certain percentage of the fair market value that is determined by local assessors to be the total taxable value of land and additions on the property. | Land | Improvement |
|---|---|---|---|---|
| 2025 | $1,452 | $49,700 | $0 | $0 |
| 2024 | $1,452 | $48,700 | $0 | $0 |
| 2023 | $1,391 | $41,800 | $0 | $0 |
| 2022 | $1,590 | $30,500 | $0 | $0 |
| 2021 | $1,558 | $21,200 | $0 | $0 |
| 2019 | $1,630 | $18,400 | $0 | $0 |
| 2018 | $1,381 | $16,400 | $0 | $0 |
| 2017 | $511 | $16,200 | $0 | $0 |
| 2016 | $1,985 | $19,000 | $0 | $0 |
| 2015 | $2,340 | $23,400 | $0 | $0 |
| 2013 | $3,340 | $33,400 | $0 | $0 |
| 2012 | $2,862 | $36,300 | $3,500 | $32,800 |
Source: Public Records
Map
Nearby Homes
- 53 Leslie St
- 190 W Buena Vista St
- 1565 Glendale St
- 107 Sturtevant St
- 352 Highland St
- 169 Avalon St
- 13300 Woodrow Wilson St
- 163 Waverly St
- 161 Waverly St
- 364 Cortland St
- 1568 Highland St
- 1671 W Buena Vista St
- 1636 Fullerton St
- 1689 Tyler St
- 1679 Clements St
- 82 W Buena Vista St
- 1706 Clements St
- 189 Richton St
- 293 Monterey St
- 1956 Glendale St
- 315 W Buena Vista St
- 309 W Buena Vista St
- 307 W Buena Vista St
- 301 W Buena Vista St
- 312 Avalon St
- 310 Avalon St
- 318 Avalon St
- 312 W Buena Vista St
- 297 W Buena Vista St
- 304 Avalon St
- 321 W Buena Vista St
- 308 W Buena Vista St
- 316 W Buena Vista St
- 306 W Buena Vista St
- 308 Avalon St
- 320 Buena
- 302 Avalon St
- 320 W Buena Vista St
- 295 W Buena Vista St
- 304 W Buena Vista St