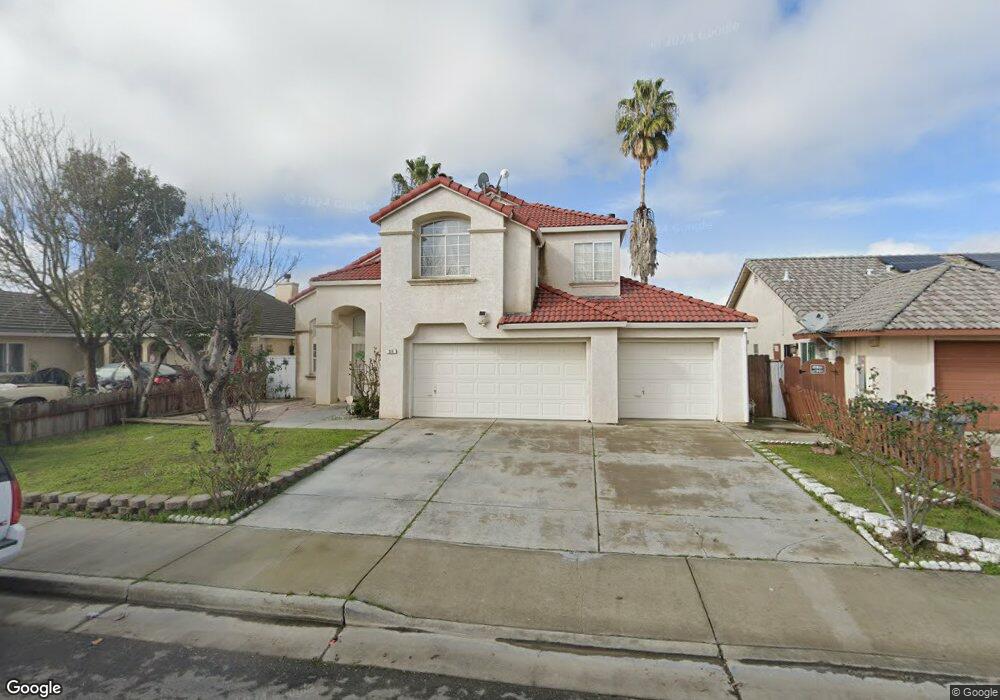
311 Ward Rd Los Banos, CA 93635
Estimated Value: $358,000 - $505,000
4
Beds
3
Baths
2,071
Sq Ft
$219/Sq Ft
Est. Value
About This Home
This home is located at 311 Ward Rd, Los Banos, CA 93635 and is currently estimated at $453,013, approximately $218 per square foot. 311 Ward Rd is a home located in Merced County with nearby schools including Grasslands Elementary School, Los Banos Junior High School, and Pacheco High School.
Ownership History
Date
Name
Owned For
Owner Type
Purchase Details
Closed on
Dec 30, 2019
Sold by
Singh Kulvinder and Mattu Kulvinder Singh
Bought by
Mattu Kulvinder Singh and Lasher Jasdeep Singh
Current Estimated Value
Purchase Details
Closed on
Nov 1, 2000
Sold by
Kaur Kamaljeet
Bought by
Singh Kulvinder
Home Financials for this Owner
Home Financials are based on the most recent Mortgage that was taken out on this home.
Original Mortgage
$164,000
Interest Rate
7.88%
Purchase Details
Closed on
Oct 17, 2000
Sold by
Le Lam Linh B and Le Ngan Thi
Bought by
Singh Kulvinder
Home Financials for this Owner
Home Financials are based on the most recent Mortgage that was taken out on this home.
Original Mortgage
$164,000
Interest Rate
7.88%
Purchase Details
Closed on
Sep 17, 1997
Sold by
Jo Lin Park Manor Associates A Partner
Bought by
Lam Linh B and Le Ngan Thi
Home Financials for this Owner
Home Financials are based on the most recent Mortgage that was taken out on this home.
Original Mortgage
$116,000
Interest Rate
7.44%
Create a Home Valuation Report for This Property
The Home Valuation Report is an in-depth analysis detailing your home's value as well as a comparison with similar homes in the area
Home Values in the Area
Average Home Value in this Area
Purchase History
| Date | Buyer | Sale Price | Title Company |
|---|---|---|---|
| Mattu Kulvinder Singh | -- | None Available | |
| Singh Kulvinder | -- | Transcounty Title Company | |
| Singh Kulvinder | $205,000 | Transcounty Title Company | |
| Lam Linh B | $145,000 | Fidelity National Title Co |
Source: Public Records
Mortgage History
| Date | Status | Borrower | Loan Amount |
|---|---|---|---|
| Closed | Singh Kulvinder | $164,000 | |
| Previous Owner | Lam Linh B | $116,000 |
Source: Public Records
Tax History Compared to Growth
Tax History
| Year | Tax Paid | Tax Assessment Tax Assessment Total Assessment is a certain percentage of the fair market value that is determined by local assessors to be the total taxable value of land and additions on the property. | Land | Improvement |
|---|---|---|---|---|
| 2025 | $3,719 | $308,878 | $52,725 | $256,153 |
| 2024 | $3,719 | $302,823 | $51,692 | $251,131 |
| 2023 | $3,510 | $296,886 | $50,679 | $246,207 |
| 2022 | $3,445 | $291,066 | $49,686 | $241,380 |
| 2021 | $3,391 | $285,360 | $48,712 | $236,648 |
| 2020 | $3,336 | $282,435 | $48,213 | $234,222 |
| 2019 | $3,275 | $276,898 | $47,268 | $229,630 |
| 2018 | $3,178 | $271,470 | $46,342 | $225,128 |
| 2017 | $3,139 | $266,148 | $45,434 | $220,714 |
| 2016 | $3,173 | $260,931 | $44,544 | $216,387 |
| 2015 | $3,111 | $257,012 | $43,875 | $213,137 |
| 2014 | $2,629 | $216,000 | $30,000 | $186,000 |
Source: Public Records
Map
Nearby Homes
- 2271 Corsico Ct
- 256 Murano St
- 2075 Martin St
- 2490 N Fallbrook Dr
- 2066 Greenbriar Dr
- 2080 Constantine Ct
- 2537 N Creekside Dr
- 2095 Palermo Dr
- 2198 Canal Farm Ln
- 2045 Edwards St
- 2191 Canal Farm Ln
- 3224-3264 E Pacheco Blvd
- 2505 E Pacheco Blvd
- 2272 Sanders Ct
- 2527 E Pacheco Blvd
- 615 Heron Dr
- 2812 Egret Ln
- 2149 E Pacheco Blvd
- 1453 Willmott Rd
- 256 San Pelmo Ct
- 315 Ward Rd
- 307 Ward Rd
- 314 Park Sharon Dr
- 310 Park Sharon Dr
- 318 Park Sharon Dr
- 319 Ward Rd
- 303 Ward Rd
- 306 Park Sharon Dr
- 322 Park Sharon Dr
- 323 Ward Rd
- 301 Ward Rd
- 326 Park Sharon Dr
- 302 Park Sharon Dr
- 327 Ward Rd
- 330 Park Sharon Dr
- 2249 Park Arcadia Ct
- 317 Park Sharon Dr
- 461 Heather Creek Dr
- 457 Heather Creek Dr
- 465 Heather Creek Dr