Estimated Value: $263,000 - $499,000
3
Beds
2
Baths
1,486
Sq Ft
$244/Sq Ft
Est. Value
About This Home
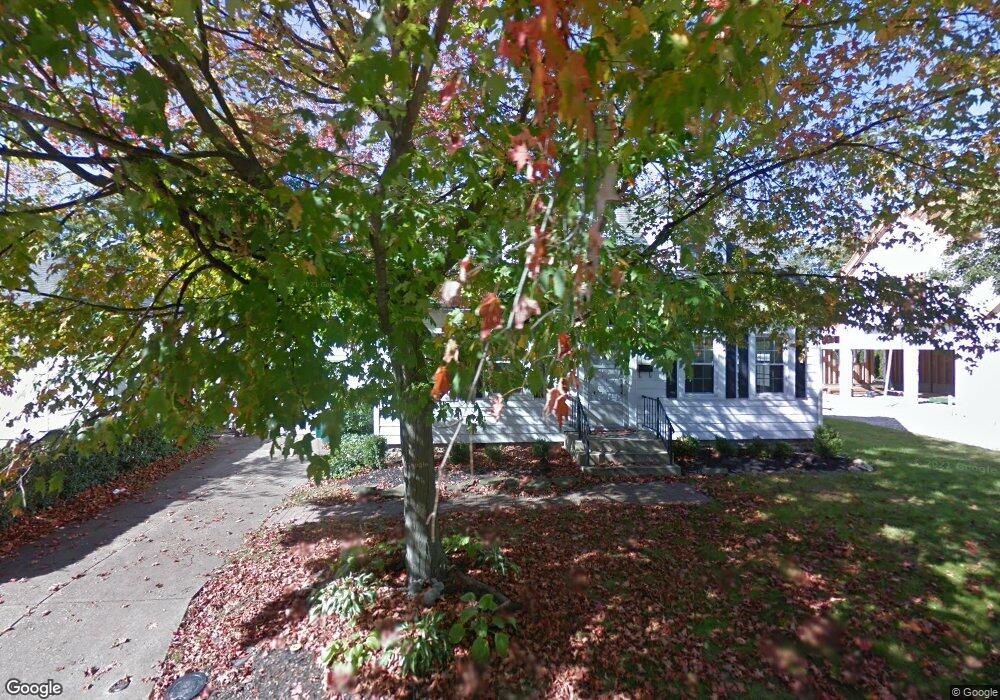
This home is located at 311 Winona Ave, Huron, OH 44839 and is currently estimated at $363,248, approximately $244 per square foot. 311 Winona Ave is a home located in Erie County with nearby schools including Shawnee Elementary School, Woodlands Intermediate School, and McCormick Junior High School.
Ownership History
Date
Name
Owned For
Owner Type
Purchase Details
Closed on
Dec 10, 2024
Sold by
Mcclurg Family Trust and Mcclurg Thomas J
Bought by
Mcclurg Thomas J and Mcclurg Marilyn K
Current Estimated Value
Purchase Details
Closed on
Jan 28, 2021
Sold by
Snow John T and John T Snow Jr Trust
Bought by
Mcclurg Thomas J and Mcclurg Marilyn K
Purchase Details
Closed on
Dec 14, 2012
Sold by
King James M and King Marrianne H
Bought by
Snow John T and John T Snow Jr Trust
Purchase Details
Closed on
Jan 20, 2012
Sold by
Snow John
Bought by
Snow John T and John T Snow Jr Trust
Purchase Details
Closed on
Sep 1, 2008
Sold by
Bauer Betty J
Bought by
Snow John and Snow Kimberly
Home Financials for this Owner
Home Financials are based on the most recent Mortgage that was taken out on this home.
Original Mortgage
$236,720
Interest Rate
6.55%
Mortgage Type
New Conventional
Create a Home Valuation Report for This Property
The Home Valuation Report is an in-depth analysis detailing your home's value as well as a comparison with similar homes in the area
Home Values in the Area
Average Home Value in this Area
Purchase History
| Date | Buyer | Sale Price | Title Company |
|---|---|---|---|
| Mcclurg Thomas J | $333 | None Listed On Document | |
| Mcclurg Thomas J | -- | None Available | |
| Snow John T | $147,850 | None Available | |
| Snow John T | -- | Attorney | |
| Snow John | $295,900 | None Available |
Source: Public Records
Mortgage History
| Date | Status | Borrower | Loan Amount |
|---|---|---|---|
| Previous Owner | Snow John | $236,720 |
Source: Public Records
Tax History Compared to Growth
Tax History
| Year | Tax Paid | Tax Assessment Tax Assessment Total Assessment is a certain percentage of the fair market value that is determined by local assessors to be the total taxable value of land and additions on the property. | Land | Improvement |
|---|---|---|---|---|
| 2024 | $3,725 | $90,537 | $20,520 | $70,017 |
| 2023 | $3,725 | $63,542 | $15,785 | $47,757 |
| 2022 | $2,698 | $63,546 | $15,785 | $47,761 |
| 2021 | $2,692 | $63,550 | $15,790 | $47,760 |
| 2020 | $2,583 | $59,390 | $15,790 | $43,600 |
| 2019 | $2,694 | $59,390 | $15,790 | $43,600 |
| 2018 | $2,708 | $59,390 | $15,790 | $43,600 |
| 2017 | $2,618 | $55,750 | $35,680 | $20,070 |
| 2016 | $2,537 | $55,750 | $35,680 | $20,070 |
| 2015 | $2,538 | $55,750 | $35,680 | $20,070 |
| 2014 | $2,567 | $55,750 | $35,680 | $20,070 |
| 2013 | $2,532 | $55,750 | $35,680 | $20,070 |
Source: Public Records
Map
Nearby Homes
- 1003 Cove Cir
- 613 Oneida View Place
- 516 Lincoln Ave
- 521 Washington Ave
- 515 Berlin Rd
- 542 Berlin Rd
- 1120 By the Shores Dr Unit 2
- 1110 By the Shores Dr Unit 3
- 1135 Cleveland Rd E
- 811 Berlin Rd
- 0 E Tracht Meadows Dr Unit 20252017
- 1728 Shearwater Cir E
- 346 Main St
- 0 Main St
- 4077 Coventry Cir
- 505 Liberty Dr Unit 9B
- 927 Dallas Dr
- 11 Turtle Bay
- 620 Cleveland Rd W
- 205 Wheeler Dr
- 309 Winona Ave
- 313 Winona Ave
- 316 Kiwanis Ave
- 812 Crescent Dr
- 308 Kiwanis Ave
- 318 Kiwanis Ave
- 312 Winona Ave
- 814 Crescent Dr
- 804 Crescent Dr
- 805 Franklin Dr
- 816 Crescent Dr
- 320 Kiwanis Ave
- 813 Franklin Dr
- 313 Wasta Ave
- 309 Kiwanis Ave
- 802 Crescent Dr
- 313 Kiwanis Ave
- 815 Franklin Dr
- 307 Kiwanis Ave
- 818 Crescent Dr