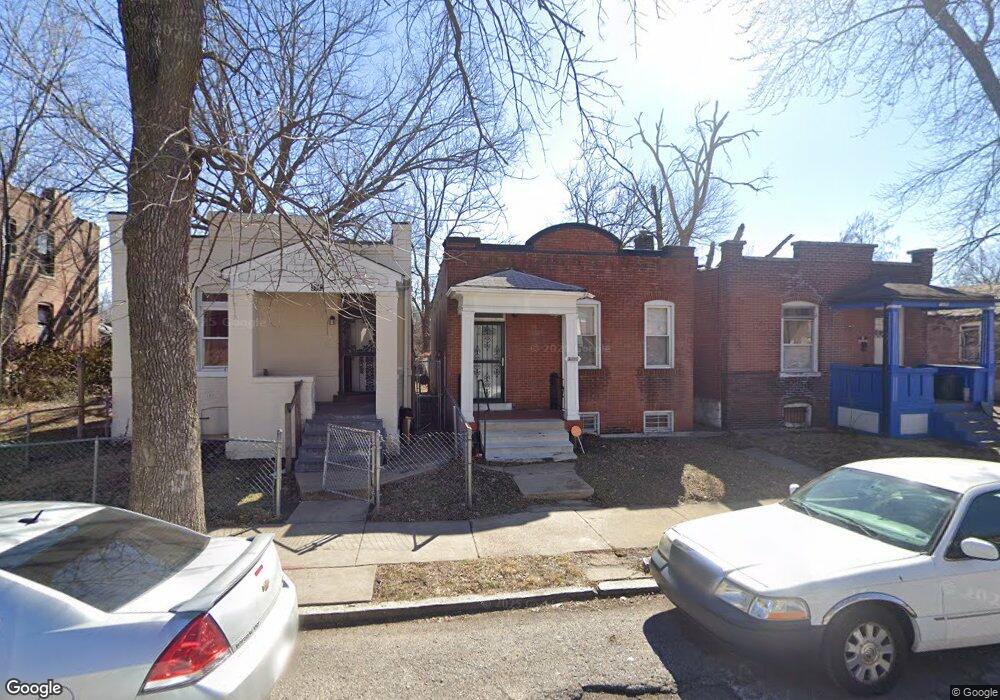
3110 Rolla Place Saint Louis, MO 63115
Greater Ville NeighborhoodEstimated Value: $38,000 - $50,000
1
Bed
1
Bath
1,012
Sq Ft
$44/Sq Ft
Est. Value
About This Home
This home is located at 3110 Rolla Place, Saint Louis, MO 63115 and is currently estimated at $44,377, approximately $43 per square foot. 3110 Rolla Place is a home located in St. Louis City with nearby schools including Hickey Elementary School, Sumner High School, and Emerson Academy Therapeutic School.
Ownership History
Date
Name
Owned For
Owner Type
Purchase Details
Closed on
Jul 25, 2014
Sold by
Russell Tyania
Bought by
Bass Deloris
Current Estimated Value
Purchase Details
Closed on
Apr 20, 2009
Sold by
Ross Samuel D and Ross Jennifer
Bought by
Russell Tyania and Bass Delores
Purchase Details
Closed on
Feb 24, 2009
Sold by
Fannie Mae
Bought by
Ross Samuel and Ross Jennifer
Purchase Details
Closed on
Sep 2, 2008
Sold by
Sims Tracie
Bought by
Flagstar Bank Fsb
Purchase Details
Closed on
Aug 25, 2006
Sold by
Chattman Maggie L and Bobo Robin R
Bought by
Sims Tracie
Home Financials for this Owner
Home Financials are based on the most recent Mortgage that was taken out on this home.
Original Mortgage
$56,500
Interest Rate
6.72%
Mortgage Type
Purchase Money Mortgage
Purchase Details
Closed on
Dec 28, 2002
Sold by
Hampton Marie
Bought by
Chattman Maggie L and Bobo Robin P
Create a Home Valuation Report for This Property
The Home Valuation Report is an in-depth analysis detailing your home's value as well as a comparison with similar homes in the area
Home Values in the Area
Average Home Value in this Area
Purchase History
| Date | Buyer | Sale Price | Title Company |
|---|---|---|---|
| Bass Deloris | -- | None Available | |
| Russell Tyania | -- | None Available | |
| Ross Samuel | -- | None Available | |
| Flagstar Bank Fsb | $68,680 | None Available | |
| Sims Tracie | -- | None Available | |
| Chattman Maggie L | -- | -- |
Source: Public Records
Mortgage History
| Date | Status | Borrower | Loan Amount |
|---|---|---|---|
| Previous Owner | Sims Tracie | $56,500 |
Source: Public Records
Tax History
| Year | Tax Paid | Tax Assessment Tax Assessment Total Assessment is a certain percentage of the fair market value that is determined by local assessors to be the total taxable value of land and additions on the property. | Land | Improvement |
|---|---|---|---|---|
| 2025 | $262 | $2,900 | $150 | $2,750 |
| 2024 | $251 | $2,800 | $150 | $2,650 |
| 2023 | $251 | $2,800 | $150 | $2,650 |
| 2022 | $251 | $2,700 | $150 | $2,550 |
| 2021 | $251 | $2,700 | $150 | $2,550 |
| 2020 | $249 | $2,700 | $150 | $2,550 |
| 2019 | $248 | $2,700 | $150 | $2,550 |
| 2018 | $225 | $2,340 | $150 | $2,190 |
| 2017 | $222 | $2,340 | $150 | $2,190 |
| 2016 | $240 | $2,530 | $340 | $2,190 |
| 2015 | $220 | $2,530 | $340 | $2,190 |
| 2014 | $215 | $2,530 | $340 | $2,190 |
| 2013 | -- | $2,470 | $340 | $2,130 |
Source: Public Records
Map
Nearby Homes
- 3130 Whittier St
- 3121 Fair Ave
- 4237 W Ashland Ave
- 3119 N Sarah St
- 4200 E Labadie Ave
- 4275 E Ashland Ave
- 3125 Clay Ave
- 4153 E Lexington Ave
- 4138 Saint Louis Ave
- 4258 E Saint Louis Ave
- 4239 W Ashland Ave
- 3715 Fair Ave
- 4059 Maffitt Ave
- 4225 E Sacramento Ave
- 4003 Lexington Ave
- 4017 Maffitt Ave
- 3936 Lexington Ave
- 4036 Kennerly Ave
- 4414 Elmbank Ave
- 4427 Greer Ave
- 3112 Rolla Place
- 3108 Rolla Place
- 3118 Rolla Place
- 3102 Rolla Place
- 3111 Whittier St
- 3122 Rolla Place
- 3100 Rolla Place
- 3115 Whittier St
- 3117 Whittier St
- 3121 Whittier St
- 3048 Rolla Place
- 3103 Whittier St
- 3126 Rolla Place
- 3123 Whittier St
- 3111 Rolla Place
- 3101 Whittier St
- 3109 Rolla Place
- 3115 Rolla Place
- 3107 Rolla Place
- 3117 Rolla Place
Your Personal Tour Guide
Ask me questions while you tour the home.