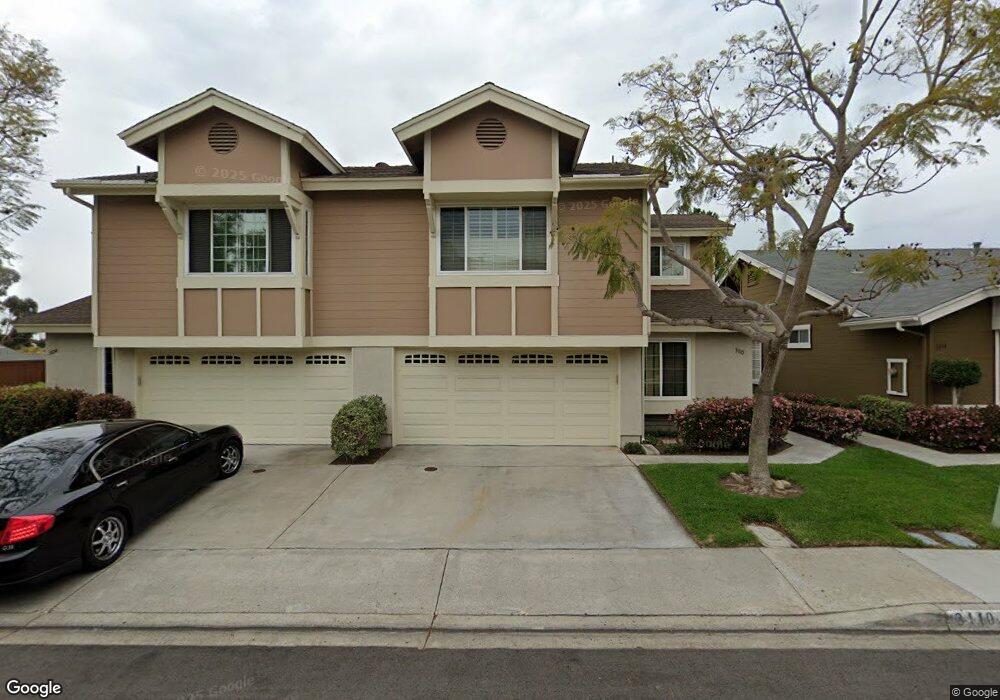
3110 W Fox Run Way San Diego, CA 92111
Clairemont Mesa West NeighborhoodEstimated Value: $1,024,000 - $1,262,000
3
Beds
3
Baths
1,630
Sq Ft
$672/Sq Ft
Est. Value
About This Home
This home is located at 3110 W Fox Run Way, San Diego, CA 92111 and is currently estimated at $1,096,143, approximately $672 per square foot. 3110 W Fox Run Way is a home located in San Diego County with nearby schools including Holmes Elementary, Marston Middle School, and Clairemont High School.
Ownership History
Date
Name
Owned For
Owner Type
Purchase Details
Closed on
Jul 28, 2017
Sold by
Hirsch Lara and Jenning Lara Hirsch
Bought by
Jennings Jason Earl and Jennings Lara Hirsch
Current Estimated Value
Purchase Details
Closed on
Mar 1, 2010
Sold by
Farrell Michael D and Farrell Mary Louise
Bought by
Hirsch Lara
Home Financials for this Owner
Home Financials are based on the most recent Mortgage that was taken out on this home.
Original Mortgage
$275,000
Outstanding Balance
$181,900
Interest Rate
4.94%
Mortgage Type
New Conventional
Estimated Equity
$914,243
Purchase Details
Closed on
Dec 2, 1997
Sold by
Farrell Michael D and Farrell Mary Louise
Bought by
Farrell Michael D and Farrell Mary Louise
Purchase Details
Closed on
Jul 21, 1997
Sold by
Bahnson Tristram D and Bahnson M P
Bought by
Farrell Michael D and Farrell Mary Louise
Home Financials for this Owner
Home Financials are based on the most recent Mortgage that was taken out on this home.
Original Mortgage
$137,500
Interest Rate
6.25%
Purchase Details
Closed on
Aug 20, 1990
Purchase Details
Closed on
Aug 26, 1983
Create a Home Valuation Report for This Property
The Home Valuation Report is an in-depth analysis detailing your home's value as well as a comparison with similar homes in the area
Home Values in the Area
Average Home Value in this Area
Purchase History
| Date | Buyer | Sale Price | Title Company |
|---|---|---|---|
| Jennings Jason Earl | -- | None Available | |
| Hirsch Lara | $495,000 | First American Title Company | |
| Farrell Michael D | -- | -- | |
| Farrell Michael D | $187,500 | Chicago Title Co | |
| -- | $217,400 | -- | |
| -- | $114,900 | -- |
Source: Public Records
Mortgage History
| Date | Status | Borrower | Loan Amount |
|---|---|---|---|
| Open | Hirsch Lara | $275,000 | |
| Previous Owner | Farrell Michael D | $137,500 |
Source: Public Records
Tax History Compared to Growth
Tax History
| Year | Tax Paid | Tax Assessment Tax Assessment Total Assessment is a certain percentage of the fair market value that is determined by local assessors to be the total taxable value of land and additions on the property. | Land | Improvement |
|---|---|---|---|---|
| 2025 | $7,642 | $638,938 | $387,237 | $251,701 |
| 2024 | $7,642 | $626,411 | $379,645 | $246,766 |
| 2023 | $7,471 | $614,129 | $372,201 | $241,928 |
| 2022 | $7,271 | $602,088 | $364,903 | $237,185 |
| 2021 | $7,220 | $590,284 | $357,749 | $232,535 |
| 2020 | $7,132 | $584,232 | $354,081 | $230,151 |
| 2019 | $7,003 | $572,778 | $347,139 | $225,639 |
| 2018 | $6,546 | $561,548 | $340,333 | $221,215 |
| 2017 | $6,389 | $550,538 | $333,660 | $216,878 |
| 2016 | $6,286 | $539,744 | $327,118 | $212,626 |
| 2015 | $6,192 | $531,638 | $322,205 | $209,433 |
| 2014 | $6,093 | $521,225 | $315,894 | $205,331 |
Source: Public Records
Map
Nearby Homes
- 3226 Old Heather Rd
- 3014 Old Bridgeport Way
- 3120 Old Bridgeport Way
- 3262 Mount Carol Dr
- 3047 Old Bridgeport Way
- 3270 W Fox Run Way Unit 2
- 3298 Old Heather Rd
- 3161 Mount Tami Dr
- 3218 Old Bridgeport Way
- 3710 Old Cobble Rd
- 3516 Old Cobble Rd
- 5581 Mount Acara Dr
- 3173 Via Arcilla
- 2868-70 Preece St
- 3581 Mount Abbey Ave
- 3405 Aveley Place
- 3413 Rollsreach Dr
- 2818 Nye St
- 2750 Wheatstone St Unit 110
- 2750 Wheatstone St Unit 113
- 3104 W Fox Run Way
- 3114 W Fox Run Way
- 3120 W Fox Run Way
- 3098 W Fox Run Way
- 3092 W Fox Run Way
- 3124 W Fox Run Way
- 3086 W Fox Run Way
- 3130 W Fox Run Way
- 3136 Old Kettle Rd
- 3130 Old Kettle Rd Unit 2
- 3126 Old Kettle Rd
- 3080 W Fox Run Way
- W W Fox Run Way
- 3134 W Fox Run Way
- 3120 Old Kettle Rd
- 3146 Old Kettle Rd
- 3074 W Fox Run Way
- 3150 Old Kettle Rd
- 3140 W Fox Run Way
- 3097 W Fox Run Way