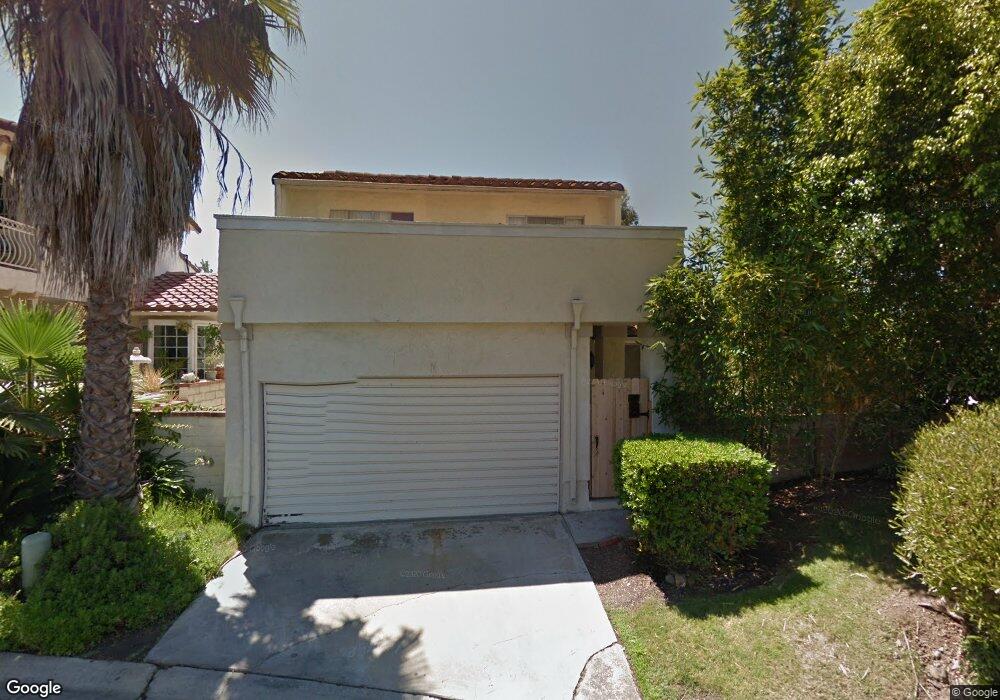
31106 Via el Rosario San Juan Capistrano, CA 92675
Estimated Value: $912,000 - $1,117,000
4
Beds
2
Baths
1,451
Sq Ft
$693/Sq Ft
Est. Value
About This Home
This home is located at 31106 Via el Rosario, San Juan Capistrano, CA 92675 and is currently estimated at $1,005,904, approximately $693 per square foot. 31106 Via el Rosario is a home located in Orange County with nearby schools including San Juan Elementary School, Marco Forster Middle School, and San Juan Hills High School.
Ownership History
Date
Name
Owned For
Owner Type
Purchase Details
Closed on
Oct 25, 2001
Sold by
Gaimbona Ida
Bought by
Hartzell Terry L
Current Estimated Value
Home Financials for this Owner
Home Financials are based on the most recent Mortgage that was taken out on this home.
Original Mortgage
$248,437
Interest Rate
6.57%
Mortgage Type
Stand Alone First
Purchase Details
Closed on
Jan 17, 1995
Sold by
Hartzell Terry Lee
Bought by
Hartzell Terry L and Giambona Ida
Home Financials for this Owner
Home Financials are based on the most recent Mortgage that was taken out on this home.
Original Mortgage
$122,550
Interest Rate
9.28%
Purchase Details
Closed on
Dec 7, 1994
Sold by
Schultes Carl and Schultes Hedwig A
Bought by
Hartzell Terry Lee
Home Financials for this Owner
Home Financials are based on the most recent Mortgage that was taken out on this home.
Original Mortgage
$122,550
Interest Rate
9.28%
Create a Home Valuation Report for This Property
The Home Valuation Report is an in-depth analysis detailing your home's value as well as a comparison with similar homes in the area
Home Values in the Area
Average Home Value in this Area
Purchase History
| Date | Buyer | Sale Price | Title Company |
|---|---|---|---|
| Hartzell Terry L | -- | -- | |
| Hartzell Terry L | -- | Chicago Title Company | |
| Hartzell Terry Lee | $153,500 | Landwood Title Company |
Source: Public Records
Mortgage History
| Date | Status | Borrower | Loan Amount |
|---|---|---|---|
| Previous Owner | Hartzell Terry L | $248,437 | |
| Previous Owner | Hartzell Terry L | $122,550 | |
| Previous Owner | Hartzell Terry Lee | $145,500 |
Source: Public Records
Tax History Compared to Growth
Tax History
| Year | Tax Paid | Tax Assessment Tax Assessment Total Assessment is a certain percentage of the fair market value that is determined by local assessors to be the total taxable value of land and additions on the property. | Land | Improvement |
|---|---|---|---|---|
| 2025 | $2,960 | $257,317 | $132,112 | $125,205 |
| 2024 | $2,960 | $252,272 | $129,522 | $122,750 |
| 2023 | $2,840 | $247,326 | $126,982 | $120,344 |
| 2022 | $2,517 | $242,477 | $124,492 | $117,985 |
| 2021 | $2,470 | $237,723 | $122,051 | $115,672 |
| 2020 | $2,449 | $235,286 | $120,800 | $114,486 |
| 2019 | $2,404 | $230,673 | $118,431 | $112,242 |
| 2018 | $2,361 | $226,150 | $116,108 | $110,042 |
| 2017 | $2,339 | $221,716 | $113,831 | $107,885 |
| 2016 | $2,223 | $217,369 | $111,599 | $105,770 |
| 2015 | $2,187 | $214,104 | $109,922 | $104,182 |
| 2014 | $2,147 | $209,910 | $107,768 | $102,142 |
Source: Public Records
Map
Nearby Homes
- 31278 Calle San Juan Unit 12
- 26468 Calle San Antonio
- 31284 Calle San Juan Unit 14
- 31261 Paseo Olivos
- 26447 Paseo Carmel Unit 11D
- 31024 Calle San Diego Unit 94b
- 31377 Los Rios St Unit 64
- 30828 Calle Chueca
- 0 Aguacate Rd Unit 25558127
- 30981 Via Mirador
- 31608 Los Rios St Unit 147
- 31527 Aguacate Rd
- 27381 Via Priorato
- 90 Plaza de Las Flores
- 5 Pointe Sur Unit 123
- 25 Niguel Pointe # 84 Dr
- 30532 Marbella Vista
- 2 Vistamar Dr
- 32011 Via Tonada Unit 9
- 6 Sand Pointe
- 31102 Via el Rosario
- 31122 Via Santo Tomas
- 31112 Via Santo Tomas
- 31128 Via Santo Tomas
- 31098 Via el Rosario
- 31154 Via Santo Tomas
- 31132 Via Santo Tomas
- 31105 Via el Rosario
- 31096 Via el Rosario
- 31152 Via Santo Tomas
- 31101 Via el Rosario
- 31098 Via Santo Tomas
- 31142 Via Santo Tomas
- 31156 Via Santo Tomas
- 31094 Via el Rosario
- 31146 Via Santo Tomas
- 31092 Via Santo Tomas
- 31075 Via el Rosario
- 31111 Via Santo Tomas
- 31158 Via Santo Tomas