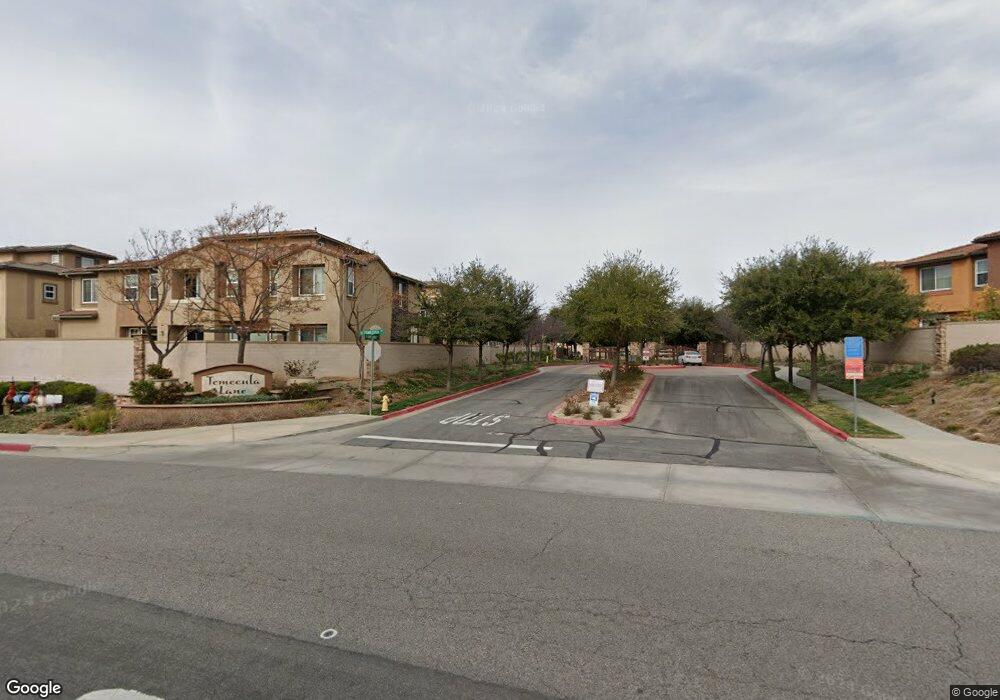
31109 Iris Way Temecula, CA 92592
Estimated Value: $452,000 - $519,000
3
Beds
3
Baths
1,411
Sq Ft
$354/Sq Ft
Est. Value
About This Home
This home is located at 31109 Iris Way, Temecula, CA 92592 and is currently estimated at $498,861, approximately $353 per square foot. 31109 Iris Way is a home located in Riverside County with nearby schools including Red Hawk Elementary, Erle Stanley Gardner Middle School, and Great Oak High School.
Ownership History
Date
Name
Owned For
Owner Type
Purchase Details
Closed on
Apr 3, 2012
Sold by
Tong Yiu Yeung and Tong Wai Ching
Bought by
Tong Yiu Yeung and Tong Wai Ching
Current Estimated Value
Purchase Details
Closed on
May 25, 2011
Sold by
Vasquez Irma Viviana and Faulhaber Irma
Bought by
Tong Yui Yeung and Tong Wai Ching
Home Financials for this Owner
Home Financials are based on the most recent Mortgage that was taken out on this home.
Original Mortgage
$127,500
Interest Rate
4.56%
Mortgage Type
New Conventional
Purchase Details
Closed on
Sep 23, 2007
Sold by
Continental Residential Inc
Bought by
Vasquez Irma Viviana and Faulhaber Irma
Home Financials for this Owner
Home Financials are based on the most recent Mortgage that was taken out on this home.
Original Mortgage
$283,249
Interest Rate
6.29%
Mortgage Type
FHA
Create a Home Valuation Report for This Property
The Home Valuation Report is an in-depth analysis detailing your home's value as well as a comparison with similar homes in the area
Purchase History
| Date | Buyer | Sale Price | Title Company |
|---|---|---|---|
| Tong Yiu Yeung | -- | None Available | |
| Tong Yui Yeung | $170,000 | Chicago Title | |
| Vasquez Irma Viviana | $310,500 | Lawyers Title Co |
Source: Public Records
Mortgage History
| Date | Status | Borrower | Loan Amount |
|---|---|---|---|
| Previous Owner | Tong Yui Yeung | $127,500 | |
| Previous Owner | Vasquez Irma Viviana | $283,249 |
Source: Public Records
Tax History
| Year | Tax Paid | Tax Assessment Tax Assessment Total Assessment is a certain percentage of the fair market value that is determined by local assessors to be the total taxable value of land and additions on the property. | Land | Improvement |
|---|---|---|---|---|
| 2025 | $2,471 | $217,783 | $64,049 | $153,734 |
| 2023 | $2,471 | $209,328 | $61,563 | $147,765 |
| 2022 | $2,402 | $205,224 | $60,356 | $144,868 |
| 2021 | $2,357 | $201,201 | $59,173 | $142,028 |
| 2020 | $2,327 | $199,139 | $58,567 | $140,572 |
| 2019 | $2,312 | $195,235 | $57,419 | $137,816 |
| 2018 | $2,271 | $191,408 | $56,294 | $135,114 |
| 2017 | $2,233 | $187,656 | $55,191 | $132,465 |
| 2016 | $2,188 | $183,977 | $54,109 | $129,868 |
| 2015 | $2,152 | $181,216 | $53,298 | $127,918 |
| 2014 | $2,092 | $177,668 | $52,255 | $125,413 |
Source: Public Records
Map
Nearby Homes
- 44891 Athel Way
- 44939 Bellflower Ln Unit 118
- 44921 Bellflower Ln Unit 111
- 31564 Calle Canto
- 45763 Via Nubes
- 45187 Via Vela
- 44921 Muirfield Dr
- 31271 Taylor Ln
- 31293 Taylor Ln
- 30752 Canterfield Dr
- 31409 Taylor Ln
- 30932 Greensboro Dr
- 44774 Adam Ln
- 45590 Alpine Place
- 44706 Adam Ln Unit 6
- 30945 Sawgrass Ct
- 45610 Masters Dr
- 45303 Esmerado Ct
- 31218 Comotilo Ct
- 31545 Via Cordoba
- 31105 Iris Way
- 31101 Iris Way
- 31113 Iris Way
- 31117 Iris Way
- 31121 Iris Way
- 31006 Strawberry Tree Ln
- 31015 Strawberry Tree Ln
- 31002 Strawberry Tree Ln
- 31019 Strawberry Tree Ln Unit 80
- 31010 Strawberry Tree Ln
- 31023 Strawberry Tree Ln
- 44961 Blue Rosemary Way Unit 88
- 44965 Blue Rosemary Way Unit 89
- 44953 Blue Rosemary Way Unit 86
- 31018 Strawberry Tree Ln
- 44957 Blue Rosemary Way Unit 87
- 44957 Blue Rosemary Way
- 44969 Blue Rosemary Way
- 31014 Strawberry Tree Ln
- 44881 Poppy Ridge Dr Unit 71
Your Personal Tour Guide
Ask me questions while you tour the home.