
Seller's Agent in 2021
Michelle Green
Russell Real Estate Services
(440) 342-0269
90 in this area
185 Total Sales
Estimated Value: $270,000 - $304,000
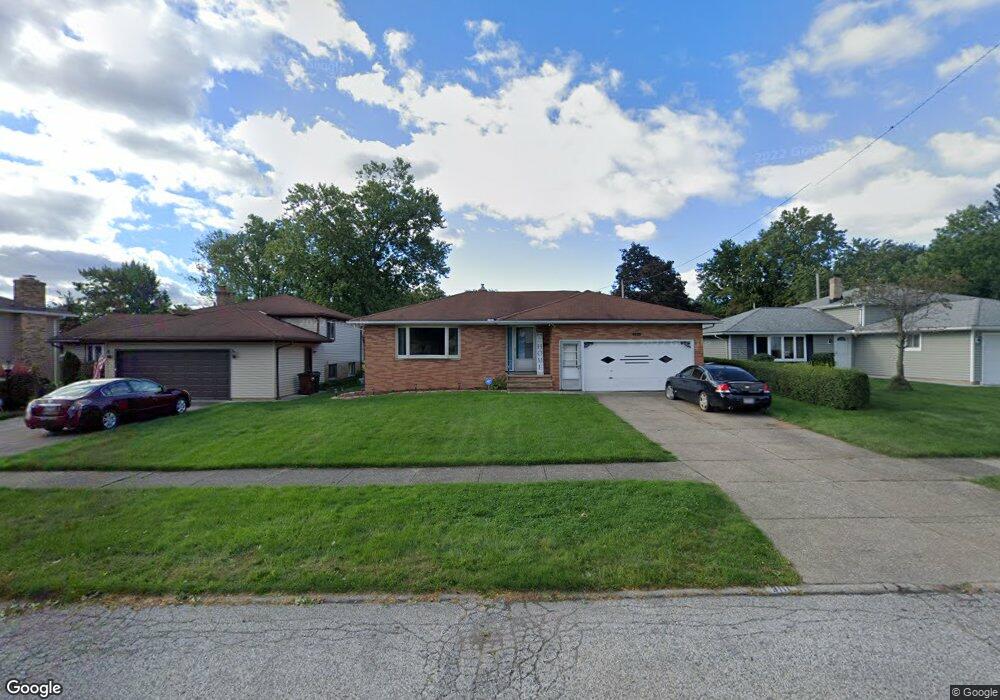
Welcome to this large all brick ranch situated on over a quarter acre lot, located in a desirable neighborhood walking distance to schools. The main floor offers over 1,400 sq. feet. The foyer flows into the kitchen. Spacious living room/dining room combo overlooking eat-in kitchen. Three generously sized bedrooms all with large closets (carpet has hardwood flooring underneath). A step down family room off the kitchen offers a half bath and a slider to a 18x17 screened in patio/porch. The large basement offers a rec room, large workshop as well as laundry and utility area. Schedule your tour today!
| Date | Buyer | Sale Price | Title Company |
|---|---|---|---|
| Yurcevis Nicholas | $120,000 | American Title | |
| Chake Bertha | -- | -- | |
| Chake Bertha | -- | -- | |
| Chake Jos | -- | -- |
| Date | Event | Price | List to Sale | Price per Sq Ft | Prior Sale |
|---|---|---|---|---|---|
| 06/11/2021 06/11/21 | Sold | $194,000 | +4.9% | $66 / Sq Ft | View Prior Sale |
| 05/21/2021 05/21/21 | Pending | -- | -- | -- | |
| 05/17/2021 05/17/21 | For Sale | $184,900 | -- | $63 / Sq Ft |
| Year | Tax Paid | Tax Assessment Tax Assessment Total Assessment is a certain percentage of the fair market value that is determined by local assessors to be the total taxable value of land and additions on the property. | Land | Improvement |
|---|---|---|---|---|
| 2024 | $4,678 | $77,770 | $14,700 | $63,070 |
| 2023 | $4,180 | $59,780 | $12,075 | $47,705 |
| 2022 | $4,144 | $59,780 | $12,080 | $47,710 |
| 2021 | $3,692 | $59,780 | $12,080 | $47,710 |
| 2020 | $3,398 | $50,230 | $10,150 | $40,080 |
| 2019 | $3,250 | $143,500 | $29,000 | $114,500 |
| 2018 | $1,636 | $50,230 | $10,150 | $40,080 |
| 2017 | $3,182 | $46,420 | $9,350 | $37,070 |
| 2016 | $3,162 | $46,420 | $9,350 | $37,070 |
| 2015 | $3,123 | $46,420 | $9,350 | $37,070 |
| 2014 | $3,123 | $47,850 | $9,630 | $38,220 |
Seller's Agent in 2021
Michelle Green
Russell Real Estate Services
(440) 342-0269
90 in this area
185 Total Sales
Buyer's Agent in 2021
Monica Rivera
Platinum Real Estate
(216) 905-3555
13 in this area
160 Total Sales