Estimated Value: $244,000 - $353,000
2
Beds
1
Bath
970
Sq Ft
$319/Sq Ft
Est. Value
About This Home
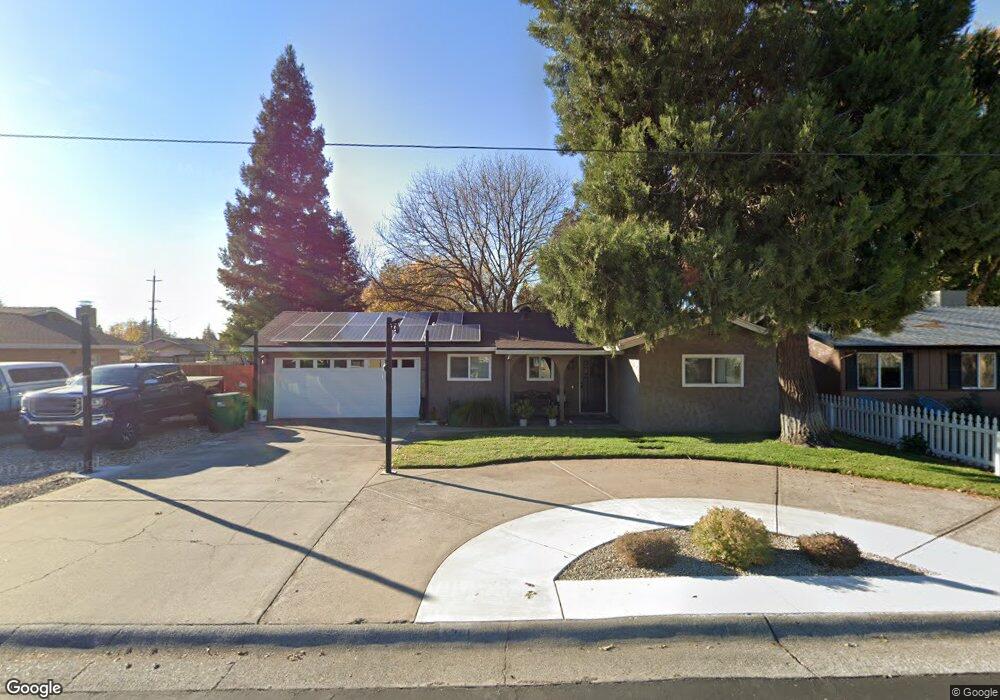
This home is located at 3111 Michael Way, Chico, CA 95973 and is currently estimated at $309,785, approximately $319 per square foot. 3111 Michael Way is a home located in Butte County with nearby schools including Neal Dow Elementary School, Bidwell Junior High School, and Pleasant Valley High School.
Ownership History
Date
Name
Owned For
Owner Type
Purchase Details
Closed on
Jul 3, 2012
Sold by
Williamson Kristi Mantonya and Mantonya Kristi L
Bought by
Gilbert Matt
Current Estimated Value
Purchase Details
Closed on
Aug 24, 2001
Sold by
Bracewell Paul and Mantonya Kristi L
Bought by
Mantonya Kristi L
Home Financials for this Owner
Home Financials are based on the most recent Mortgage that was taken out on this home.
Original Mortgage
$95,000
Interest Rate
7.09%
Create a Home Valuation Report for This Property
The Home Valuation Report is an in-depth analysis detailing your home's value as well as a comparison with similar homes in the area
Purchase History
| Date | Buyer | Sale Price | Title Company |
|---|---|---|---|
| Gilbert Matt | $156,000 | Mid Valley Title & Escrow Co | |
| Williamson Kristi Mantonya | -- | Mid Valley Title & Escrow Co | |
| Mantonya Kristi L | -- | Fidelity National Title Co |
Source: Public Records
Mortgage History
| Date | Status | Borrower | Loan Amount |
|---|---|---|---|
| Previous Owner | Mantonya Kristi L | $95,000 |
Source: Public Records
Tax History
| Year | Tax Paid | Tax Assessment Tax Assessment Total Assessment is a certain percentage of the fair market value that is determined by local assessors to be the total taxable value of land and additions on the property. | Land | Improvement |
|---|---|---|---|---|
| 2025 | $2,013 | $192,090 | $104,664 | $87,426 |
| 2024 | $2,013 | $188,324 | $102,612 | $85,712 |
| 2023 | $1,988 | $184,632 | $100,600 | $84,032 |
| 2022 | $1,953 | $181,013 | $98,628 | $82,385 |
| 2021 | $1,915 | $177,465 | $96,695 | $80,770 |
| 2020 | $1,909 | $175,646 | $95,704 | $79,942 |
| 2019 | $1,878 | $172,203 | $93,828 | $78,375 |
| 2018 | $1,842 | $168,828 | $91,989 | $76,839 |
| 2017 | $1,803 | $165,519 | $90,186 | $75,333 |
| 2016 | $1,645 | $162,274 | $88,418 | $73,856 |
| 2015 | $1,644 | $159,837 | $87,090 | $72,747 |
| 2014 | $1,616 | $156,707 | $85,385 | $71,322 |
Source: Public Records
Map
Nearby Homes
- 882 Pico Place
- 951 Pico Place
- 878 Pico Place
- 883 Pico Place
- 866 Pico Place
- 862 Pico Place
- 863 Bertino Place
- 974 Bertino Place
- 974 Bertino Place Unit 2
- 35 Jersey Brown Cir
- 2960 Burnap Ave
- 806 Alynn Way
- 982 E Lassen Ave Unit 1
- 2915 Godman Ave
- 3269 Rockin M Dr
- 701 E Lassen Ave Unit 232
- 701 E Lassen Ave Unit 173
- 701 E Lassen Ave Unit 38
- 701 E Lassen Ave Unit 108
- 701 E Lassen Ave Unit 236
- 3107 Michael Way
- 3115 Michael Way
- 3110 Johnny Ln
- 946 Eaton Rd
- 3119 Michael Way
- 3106 Johnny Ln
- 3114 Johnny Ln
- 926 Eaton Rd
- 3110 Michael Way
- 3118 Johnny Ln
- 3106 Michael Way
- 926 E Eaton Rd
- 960 Eaton Rd
- 3123 Michael Way
- 3122 Johnny Ln
- 3114 Michael Way
- 3126 Johnny Ln
- 994 Eaton Rd
- 3111 Johnny Ln
- 3107 Johnny Ln
Your Personal Tour Guide
Ask me questions while you tour the home.