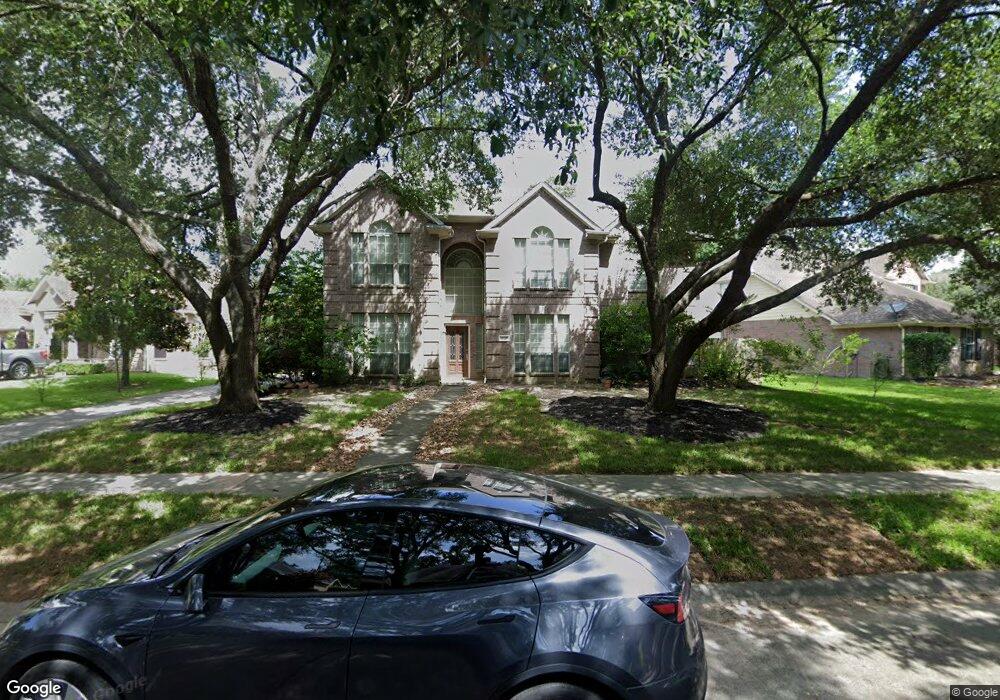
31119 Deerwood Park Ln Spring, TX 77386
Imperial Oaks NeighborhoodEstimated Value: $424,000 - $499,000
5
Beds
4
Baths
3,570
Sq Ft
$128/Sq Ft
Est. Value
About This Home
This home is located at 31119 Deerwood Park Ln, Spring, TX 77386 and is currently estimated at $456,559, approximately $127 per square foot. 31119 Deerwood Park Ln is a home located in Montgomery County with nearby schools including Kaufman Elementary School, Vogel Intermediate School, and Irons J High School.
Ownership History
Date
Name
Owned For
Owner Type
Purchase Details
Closed on
Feb 26, 2013
Sold by
Vivlamore Henry T and Vivlamore Henry Thomas
Bought by
Pritchett Josef
Current Estimated Value
Home Financials for this Owner
Home Financials are based on the most recent Mortgage that was taken out on this home.
Original Mortgage
$211,105
Outstanding Balance
$146,998
Interest Rate
3.25%
Mortgage Type
FHA
Estimated Equity
$309,561
Purchase Details
Closed on
Jul 30, 2008
Sold by
Vivlamore Charlene
Bought by
Vivlamore Henry Thomas
Purchase Details
Closed on
May 25, 2000
Sold by
Ashton Residential Llc
Bought by
Vivlamore Henry T and Vivlamore Charlene A Hession
Home Financials for this Owner
Home Financials are based on the most recent Mortgage that was taken out on this home.
Original Mortgage
$121,503
Interest Rate
8.17%
Purchase Details
Closed on
Feb 9, 1998
Sold by
Imperial Oaks Joint Venture
Bought by
Pritchett Josef
Create a Home Valuation Report for This Property
The Home Valuation Report is an in-depth analysis detailing your home's value as well as a comparison with similar homes in the area
Home Values in the Area
Average Home Value in this Area
Purchase History
| Date | Buyer | Sale Price | Title Company |
|---|---|---|---|
| Pritchett Josef | -- | First American Title | |
| Vivlamore Henry Thomas | -- | None Available | |
| Vivlamore Henry T | -- | Stewart Title | |
| Pritchett Josef | -- | -- |
Source: Public Records
Mortgage History
| Date | Status | Borrower | Loan Amount |
|---|---|---|---|
| Open | Pritchett Josef | $211,105 | |
| Previous Owner | Vivlamore Henry T | $121,503 | |
| Closed | Vivlamore Henry Thomas | $0 |
Source: Public Records
Tax History Compared to Growth
Tax History
| Year | Tax Paid | Tax Assessment Tax Assessment Total Assessment is a certain percentage of the fair market value that is determined by local assessors to be the total taxable value of land and additions on the property. | Land | Improvement |
|---|---|---|---|---|
| 2025 | $6,147 | $402,627 | -- | -- |
| 2024 | $5,485 | $366,025 | -- | -- |
| 2023 | $5,485 | $332,750 | $68,000 | $368,630 |
| 2022 | $6,976 | $302,500 | $14,190 | $0 |
| 2021 | $6,827 | $275,000 | $14,190 | $320,460 |
| 2020 | $7,107 | $275,000 | $14,190 | $286,320 |
| 2019 | $7,331 | $290,400 | $14,190 | $287,320 |
| 2018 | $6,196 | $264,000 | $14,190 | $249,810 |
| 2017 | $7,009 | $258,500 | $14,190 | $249,810 |
| 2016 | $6,702 | $247,150 | $14,190 | $261,390 |
| 2015 | $5,401 | $224,680 | $14,190 | $261,390 |
| 2014 | $5,401 | $204,250 | $14,190 | $190,060 |
Source: Public Records
Map
Nearby Homes
- 31002 Deerwood Park Ln
- 2047 Copperwood Park Ln
- 2143 Westover Park Cir
- 31030 S Imperial Path Ln
- 31235 Windcrest Park Ln
- 31214 Windcrest Park Ln
- 1803 W Welsford Dr
- 1427 Redwood Village Cir
- 1915 W Welsford Dr
- 1423 W Welsford Dr
- 1803 Moston Dr
- 2526 Hidden Park Ln
- 2618 Bridgestone Park Ln
- 1935 Invermere Dr
- 1627 Sterling Village Dr
- 32364 Mossy Pine Way
- 30927 Caraquet Ct
- 32319 Archer Park
- 30707 Dodson Trace Dr
- 31419 Fountainbrook Park Ln
- 31127 Deerwood Park Ln
- 31111 Deerwood Park Ln
- 2034 Nature Park Ln
- 31107 Deerwood Park Ln
- 31203 Deerwood Park Ln
- 2038 Nature Park Ln
- 31118 Deerwood Park Ln
- 2030 Nature Park Ln
- 31114 Deerwood Park Ln
- 31122 Deerwood Park Ln
- 31110 Deerwood Park Ln
- 31126 Deerwood Park Ln
- 31207 Deerwood Park Ln
- 31106 Deerwood Park Ln
- 2026 Nature Park Ln
- 31130 Deerwood Park Ln
- 2042 Nature Park Ln
- 31102 Deerwood Park Ln
- 31215 Deerwood Park Ln
- 2046 Nature Park Ln