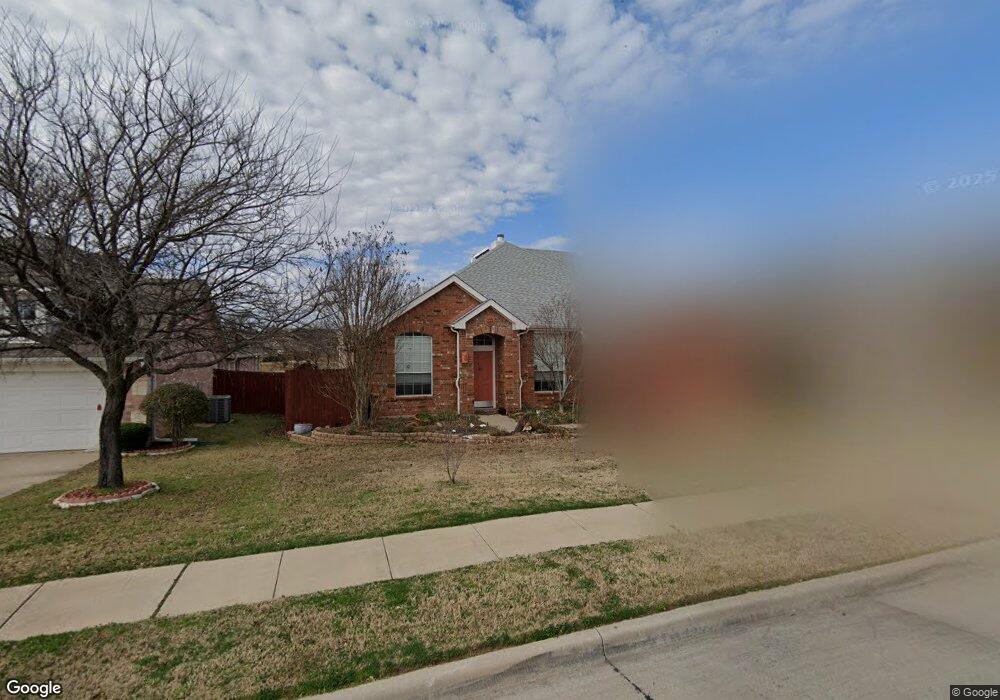
3112 Ottowa Ln Denton, TX 76210
South Denton NeighborhoodEstimated Value: $395,213 - $426,000
4
Beds
2
Baths
2,386
Sq Ft
$173/Sq Ft
Est. Value
About This Home
This home is located at 3112 Ottowa Ln, Denton, TX 76210 and is currently estimated at $411,803, approximately $172 per square foot. 3112 Ottowa Ln is a home located in Denton County with nearby schools including Houston Elementary School, McMath Middle School, and Denton High School.
Ownership History
Date
Name
Owned For
Owner Type
Purchase Details
Closed on
May 10, 2023
Sold by
Hemsell James Clenon
Bought by
James Hemsell Living Trust
Current Estimated Value
Purchase Details
Closed on
Mar 19, 2002
Sold by
Clark Peter A and Clark Lisa M
Bought by
Hemsell James C and Hemsell Lore H
Home Financials for this Owner
Home Financials are based on the most recent Mortgage that was taken out on this home.
Original Mortgage
$158,300
Interest Rate
6.83%
Purchase Details
Closed on
Nov 22, 2000
Sold by
Lennar Homes Of Texas Land & Const Ltd
Bought by
Lennar Homes Of Texas Inc and Clark Lisa M
Home Financials for this Owner
Home Financials are based on the most recent Mortgage that was taken out on this home.
Original Mortgage
$159,337
Interest Rate
7.84%
Mortgage Type
FHA
Create a Home Valuation Report for This Property
The Home Valuation Report is an in-depth analysis detailing your home's value as well as a comparison with similar homes in the area
Home Values in the Area
Average Home Value in this Area
Purchase History
| Date | Buyer | Sale Price | Title Company |
|---|---|---|---|
| James Hemsell Living Trust | -- | None Listed On Document | |
| Hemsell James C | -- | -- | |
| Hemsell James C | -- | -- | |
| Lennar Homes Of Texas Inc | -- | -- | |
| Clark Peter A | -- | -- | |
| Lennar Homes Of Texas Inc | -- | -- |
Source: Public Records
Mortgage History
| Date | Status | Borrower | Loan Amount |
|---|---|---|---|
| Previous Owner | Hemsell James C | $158,300 | |
| Previous Owner | Clark Peter A | $159,337 |
Source: Public Records
Tax History Compared to Growth
Tax History
| Year | Tax Paid | Tax Assessment Tax Assessment Total Assessment is a certain percentage of the fair market value that is determined by local assessors to be the total taxable value of land and additions on the property. | Land | Improvement |
|---|---|---|---|---|
| 2025 | $3,409 | $357,000 | $81,437 | $275,563 |
| 2024 | $7,226 | $374,347 | $0 | $0 |
| 2023 | $3,415 | $340,315 | $81,437 | $305,563 |
| 2022 | $6,568 | $309,377 | $81,437 | $264,045 |
| 2021 | $6,252 | $281,252 | $63,733 | $217,519 |
| 2020 | $6,059 | $265,080 | $63,733 | $201,347 |
| 2019 | $6,217 | $260,574 | $63,733 | $196,841 |
| 2018 | $5,755 | $238,249 | $63,733 | $186,477 |
| 2017 | $5,354 | $216,590 | $63,733 | $166,103 |
| 2016 | $4,867 | $196,900 | $42,489 | $172,332 |
| 2015 | $4,289 | $179,000 | $42,489 | $136,511 |
| 2014 | $4,289 | $182,050 | $42,489 | $141,235 |
| 2013 | -- | $165,500 | $32,000 | $133,500 |
Source: Public Records
Map
Nearby Homes
- 2312 Caddo Cir
- 2009 Lake Fork Ct
- 2209 Loon Lake Rd
- 2000 Lamprey Cir
- 2501 Great Bear Ln
- 2409 Loon Lake Rd
- 2544 Natchez Trace
- 2505 Pioneer Dr
- 2508 Pioneer Dr
- 2600 Pioneer Dr
- 3432 Sundown Blvd
- 2272 Hollyhill Ln
- 720 Smokerise Cir
- 2253 Hollyhill Ln
- 1108 Ellison Park Cir
- 916 Smokerise Cir
- 1012 Indian Ridge Dr
- 2601 Pinto Dr
- 2713 Clubhouse Dr
- 924 Ridgecrest Cir