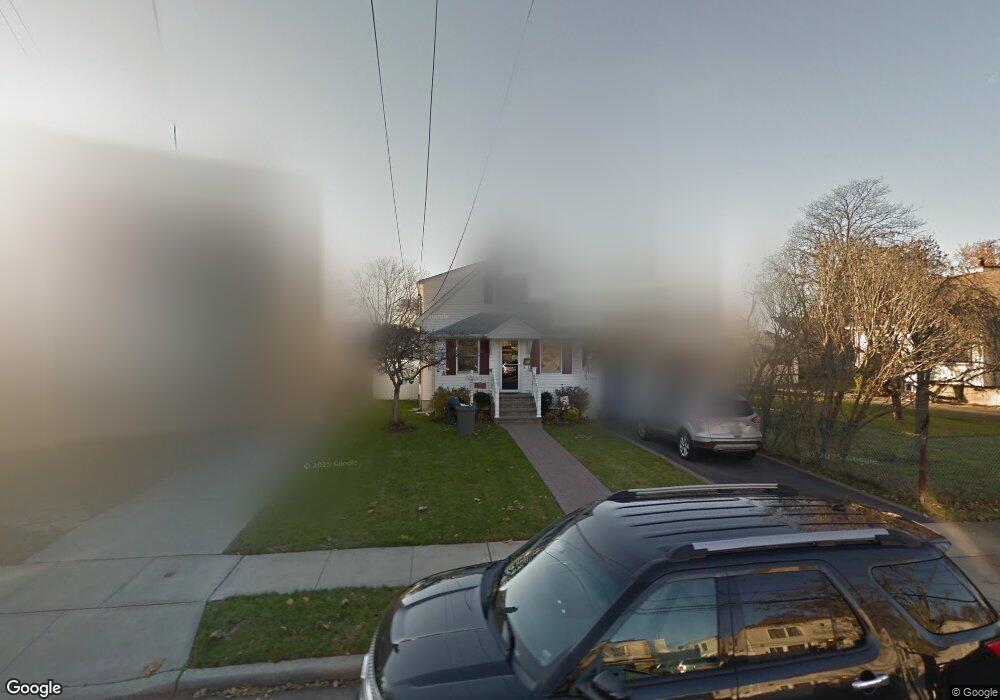
3112 Roxbury Rd Oceanside, NY 11572
Estimated Value: $524,625 - $655,000
Studio
1
Bath
1,172
Sq Ft
$519/Sq Ft
Est. Value
About This Home
This home is located at 3112 Roxbury Rd, Oceanside, NY 11572 and is currently estimated at $608,656, approximately $519 per square foot. 3112 Roxbury Rd is a home located in Nassau County with nearby schools including South Oceanside Road Elementary - School 4, Oceanside Middle School, and Oceanside High School.
Ownership History
Date
Name
Owned For
Owner Type
Purchase Details
Closed on
May 14, 2024
Sold by
Grasing Kevin P and Grasing Kathleen A
Bought by
Grasing Kevin and Grasing Kathleen A
Current Estimated Value
Create a Home Valuation Report for This Property
The Home Valuation Report is an in-depth analysis detailing your home's value as well as a comparison with similar homes in the area
Home Values in the Area
Average Home Value in this Area
Purchase History
| Date | Buyer | Sale Price | Title Company |
|---|---|---|---|
| Grasing Kevin | -- | None Available | |
| Grasing Kevin | -- | None Available |
Source: Public Records
Tax History
| Year | Tax Paid | Tax Assessment Tax Assessment Total Assessment is a certain percentage of the fair market value that is determined by local assessors to be the total taxable value of land and additions on the property. | Land | Improvement |
|---|---|---|---|---|
| 2025 | $9,583 | $422 | $165 | $257 |
| 2024 | $3,073 | $422 | $165 | $257 |
| 2023 | $8,651 | $422 | $165 | $257 |
| 2022 | $8,651 | $422 | $165 | $257 |
| 2021 | $11,666 | $407 | $159 | $248 |
| 2020 | $8,630 | $661 | $468 | $193 |
| 2019 | $8,867 | $661 | $468 | $193 |
| 2018 | $8,308 | $661 | $0 | $0 |
| 2017 | $4,586 | $661 | $468 | $193 |
| 2016 | $7,309 | $661 | $468 | $193 |
| 2015 | $2,601 | $661 | $468 | $193 |
| 2014 | $2,601 | $661 | $468 | $193 |
| 2013 | $2,418 | $661 | $468 | $193 |
Source: Public Records
Map
Nearby Homes
- 3154 Roxbury Rd
- 2975 Oceanside Rd
- 36 W Windsor Pkwy
- 21 Bellevue Ave
- 41 Weidner Ave
- 222 Chance Dr
- 295 Thorn St
- 3251 Neptune Ave
- 138 Davison Ave
- 2860 Nicole Ct
- 98 Moore Ave
- 3195 Nantucket Ln
- 3348 3rd St
- 3354 2nd St
- 3351 4th St
- 2778 King St
- 3357 Lawrence Ave
- 3363 Lawrence Ave
- 3000 Stevens St Unit 47
- 3373 Lawrence Ave
- 3116 Roxbury Rd
- 3104 Roxbury Rd
- 3120 Roxbury Rd
- 3111 Trinity St
- 3107 Trinity St
- 3117 Trinity St
- 3103 Trinity St
- 3096 Roxbury Rd
- 3126 Roxbury Rd
- 3111 Roxbury Rd
- 3105 Roxbury Rd
- 3115 Roxbury Rd
- 3123 Trinity St
- 3101 Roxbury Rd
- 3097 Trinity St
- 3121 Roxbury Rd
- 3090 Roxbury Rd
- 67 Windsor Pkwy
- 85 Windsor Pkwy
- 3095 Roxbury Rd
Your Personal Tour Guide
Ask me questions while you tour the home.