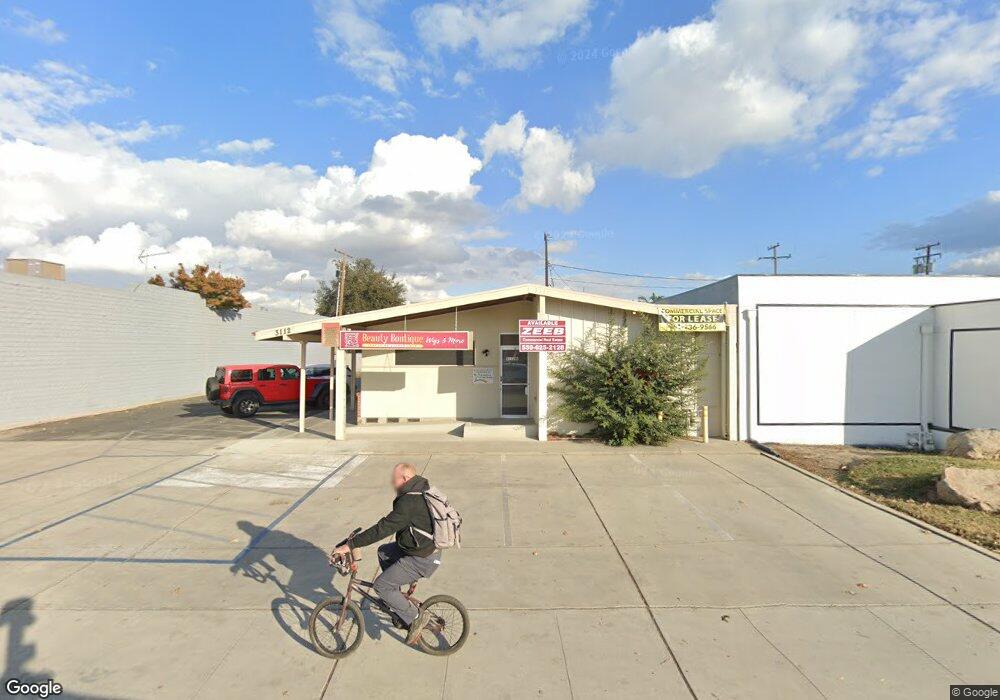
3112 S Mooney Blvd Visalia, CA 93277
Mooney NeighborhoodEstimated Value: $480,730
--
Bed
3
Baths
2,321
Sq Ft
$207/Sq Ft
Est. Value
About This Home
This home is located at 3112 S Mooney Blvd, Visalia, CA 93277 and is currently estimated at $480,730, approximately $207 per square foot. 3112 S Mooney Blvd is a home located in Tulare County with nearby schools including Mountain View Elementary School, Divisadero Middle School, and Mt. Whitney High School.
Ownership History
Date
Name
Owned For
Owner Type
Purchase Details
Closed on
Nov 11, 2022
Sold by
Mcgoo Enterprises Llc
Bought by
Prominent Properties Llc
Current Estimated Value
Purchase Details
Closed on
May 2, 2017
Sold by
Wyatt David V and Wyatt Pamela J
Bought by
Mcgoo Enterprises Llc
Home Financials for this Owner
Home Financials are based on the most recent Mortgage that was taken out on this home.
Original Mortgage
$175,000
Interest Rate
4.08%
Mortgage Type
Commercial
Purchase Details
Closed on
Aug 3, 2015
Sold by
Wyatt David Vernon and Wyatt Casey Janice Carol
Bought by
David & Pamela Wyatt Trust
Purchase Details
Closed on
Nov 23, 2011
Sold by
Wyatt David Vernon
Bought by
Joseph B Wyatt Marital Trust
Purchase Details
Closed on
Sep 14, 2004
Sold by
Wyatt Florine E
Bought by
Joseph B Wyatt Exemption Trust
Create a Home Valuation Report for This Property
The Home Valuation Report is an in-depth analysis detailing your home's value as well as a comparison with similar homes in the area
Home Values in the Area
Average Home Value in this Area
Purchase History
| Date | Buyer | Sale Price | Title Company |
|---|---|---|---|
| Prominent Properties Llc | $435,000 | Chicago Title | |
| Mcgoo Enterprises Llc | $320,000 | Chicago Title Company | |
| David & Pamela Wyatt Trust | -- | None Available | |
| Joseph B Wyatt Marital Trust | -- | None Available | |
| Joseph B Wyatt Exemption Trust | -- | -- |
Source: Public Records
Mortgage History
| Date | Status | Borrower | Loan Amount |
|---|---|---|---|
| Previous Owner | Mcgoo Enterprises Llc | $175,000 |
Source: Public Records
Tax History Compared to Growth
Tax History
| Year | Tax Paid | Tax Assessment Tax Assessment Total Assessment is a certain percentage of the fair market value that is determined by local assessors to be the total taxable value of land and additions on the property. | Land | Improvement |
|---|---|---|---|---|
| 2025 | $4,767 | $452,574 | $156,060 | $296,514 |
| 2024 | $4,767 | $443,700 | $153,000 | $290,700 |
| 2023 | $3,807 | $356,967 | $139,440 | $217,527 |
| 2022 | $3,638 | $349,968 | $136,706 | $213,262 |
| 2021 | $3,642 | $343,105 | $134,025 | $209,080 |
| 2020 | $3,616 | $339,587 | $132,651 | $206,936 |
| 2019 | $3,508 | $332,928 | $130,050 | $202,878 |
| 2018 | $3,424 | $326,400 | $127,500 | $198,900 |
| 2017 | $888 | $84,477 | $59,147 | $25,330 |
| 2016 | $878 | $82,820 | $57,987 | $24,833 |
| 2015 | $866 | $81,576 | $57,116 | $24,460 |
| 2014 | $869 | $79,978 | $55,997 | $23,981 |
Source: Public Records
Map
Nearby Homes
- 0 S Mooney Blvd
- 1700 W La Vida Ave
- 1631 W Monte Vista Ave
- 1602 W Dorothea Ave
- 3409 S Hall St
- 2646 S Fairway Ct
- 2532 W Chestnut Ct
- 1449 W Whitendale Ave
- 2944 S Verde Vista St
- 1414 W Whitendale Ave
- 3439 S Lincoln Ct
- 2820 W Dorothea Ave
- 2922 S Linda Vista St
- 2741 W Mission Ct
- 2724 S County Center Dr
- 2301 S Divisadero St Unit 9
- 2245 S Sallee St
- 3409 S Vickie Ct
- 1031 W Hemlock Ave
- 3847 S Verde Vista St
- 3112 S Mooney Blvd Unit 3
- 3120 S Mooney Blvd
- 3106 S Mooney Blvd
- 3104 S Mooney Blvd
- 2008 W Dorothea Ave Unit 204
- 2008 W Dorothea Ave Unit 203
- 2008 W Dorothea Ave Unit 202
- 2008 W Dorothea Ave Unit 201
- 2008 W Dorothea Ave Unit 106
- 2008 W Dorothea Ave Unit 105
- 2008 W Dorothea Ave Unit 102
- 3100 S Mooney Blvd
- 2200 W Sunnyside Ave
- 3103 S Mooney Blvd
- 2010 W Sunnyside Ave
- 3232 S Mooney Blvd
- 1933 W Sunnyside Ave
- 1944 W Sunnyside Ave
- 3225 S Mooney Blvd
- 3246 S Mooney Blvd