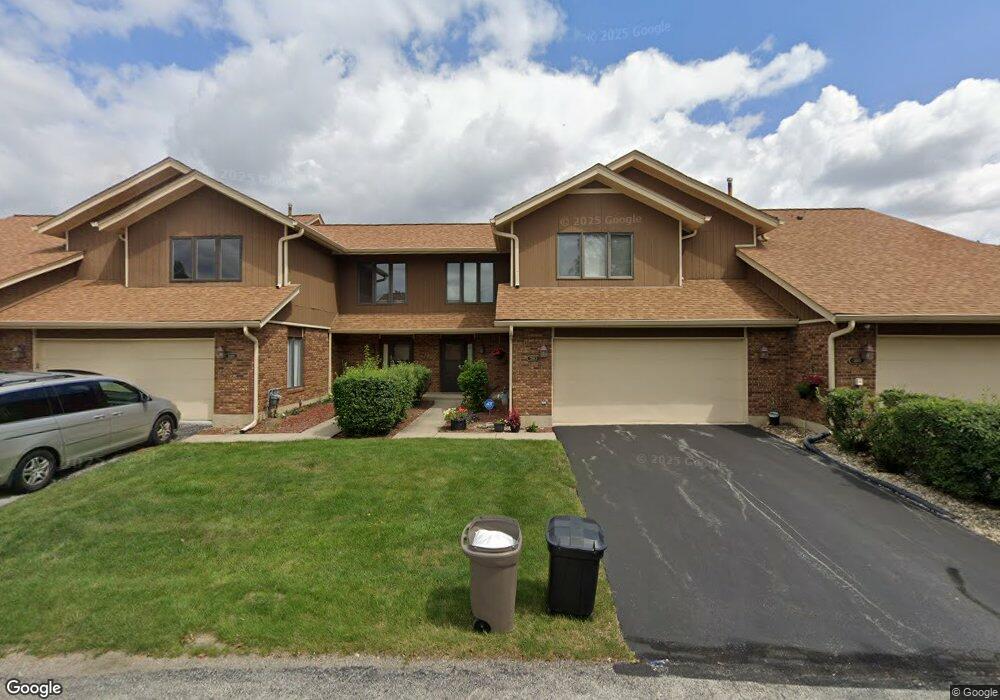
3113 Elaine Ct Unit 202 Flossmoor, IL 60422
Estimated Value: $242,217 - $270,000
--
Bed
--
Bath
166,394
Sq Ft
$2/Sq Ft
Est. Value
About This Home
This home is located at 3113 Elaine Ct Unit 202, Flossmoor, IL 60422 and is currently estimated at $254,554, approximately $1 per square foot. 3113 Elaine Ct Unit 202 is a home located in Cook County with nearby schools including Heather Hill Elementary School, Parker Junior High School, and Homewood-Flossmoor High School.
Ownership History
Date
Name
Owned For
Owner Type
Purchase Details
Closed on
Sep 15, 2006
Sold by
Nwokolo Nwanneka
Bought by
Lacy Georgia M
Current Estimated Value
Home Financials for this Owner
Home Financials are based on the most recent Mortgage that was taken out on this home.
Original Mortgage
$173,600
Outstanding Balance
$103,204
Interest Rate
6.58%
Mortgage Type
Purchase Money Mortgage
Estimated Equity
$151,350
Purchase Details
Closed on
Jun 5, 2001
Sold by
Ellis Brian W and Ellis Jeanette T
Bought by
Nwokolo Nwanneka
Home Financials for this Owner
Home Financials are based on the most recent Mortgage that was taken out on this home.
Original Mortgage
$144,400
Interest Rate
7.11%
Purchase Details
Closed on
May 26, 1994
Sold by
Lasalle National Trust Na
Bought by
Ellis Brian W and Conrad Jeanette T
Home Financials for this Owner
Home Financials are based on the most recent Mortgage that was taken out on this home.
Original Mortgage
$155,000
Interest Rate
6%
Create a Home Valuation Report for This Property
The Home Valuation Report is an in-depth analysis detailing your home's value as well as a comparison with similar homes in the area
Home Values in the Area
Average Home Value in this Area
Purchase History
| Date | Buyer | Sale Price | Title Company |
|---|---|---|---|
| Lacy Georgia M | $217,000 | Residential Title Services | |
| Nwokolo Nwanneka | $152,000 | -- | |
| Ellis Brian W | $172,500 | -- |
Source: Public Records
Mortgage History
| Date | Status | Borrower | Loan Amount |
|---|---|---|---|
| Open | Lacy Georgia M | $173,600 | |
| Previous Owner | Nwokolo Nwanneka | $144,400 | |
| Previous Owner | Ellis Brian W | $155,000 |
Source: Public Records
Tax History Compared to Growth
Tax History
| Year | Tax Paid | Tax Assessment Tax Assessment Total Assessment is a certain percentage of the fair market value that is determined by local assessors to be the total taxable value of land and additions on the property. | Land | Improvement |
|---|---|---|---|---|
| 2024 | $3,719 | $23,491 | $1,215 | $22,276 |
| 2023 | $4,480 | $23,491 | $1,215 | $22,276 |
| 2022 | $4,480 | $15,170 | $3,443 | $11,727 |
| 2021 | $4,585 | $15,169 | $3,443 | $11,726 |
| 2020 | $6,229 | $15,169 | $3,443 | $11,726 |
| 2019 | $6,879 | $16,194 | $3,240 | $12,954 |
| 2018 | $6,617 | $16,194 | $3,240 | $12,954 |
| 2017 | $6,527 | $16,194 | $3,240 | $12,954 |
| 2016 | $6,523 | $14,814 | $3,038 | $11,776 |
| 2015 | $6,487 | $14,814 | $3,038 | $11,776 |
| 2014 | $6,394 | $14,814 | $3,038 | $11,776 |
| 2013 | $6,159 | $15,521 | $3,038 | $12,483 |
Source: Public Records
Map
Nearby Homes
- 3118 Elaine Ct Unit 232
- 3037 Candlewood Ct
- 2931 Sunset Ave
- 2929 Flossmoor Rd
- 19020 Kedzie Ave
- 3045 Scott Crescent
- 1248 Berry Ln
- 3232 Chestnut Dr
- 1248 Oakmont Ave
- 1450 Tanglewood St Unit 1B
- 1402 Berry Ln
- 2817 Flossmoor Rd
- 926 Braemar Rd
- 1437 Woodhollow Dr
- 3013 Mac Heath Crescent
- 1141 Leavitt Ave Unit 115
- 1139 Leavitt Ave Unit 212
- 1139 Leavitt Ave Unit 313
- 1117 Leavitt Ave Unit 110
- 3533 Flossmoor Rd
- 3111 Elaine Ct Unit 201
- 3115 Elaine Ct Unit 203
- 3117 Elaine Ct Unit 204
- 3106 Candlewood Ct Unit 32
- 3051 Elaine Ct Unit 213
- 3110 Candlewood Ct Unit 41
- 3102 Candlewood Ct Unit 31
- 3114 Candlewood Ct Unit 42
- 3116 Elaine Ct Unit 231
- 3056 Elaine Ct Unit 221
- 3050 Elaine Ct Unit 222
- 3050 Candlewood Ct Unit 2
- 3050 Candlewood Ct Unit 21
- 3043 Elaine Ct Unit 211
- 3048 Elaine Ct Unit 223
- 3046 Candlewood Ct Unit 22
- 1158 Baythorne Dr Unit 112
- 1154 Baythorne Dr Unit 111
- 3042 Candlewood Ct Unit 23