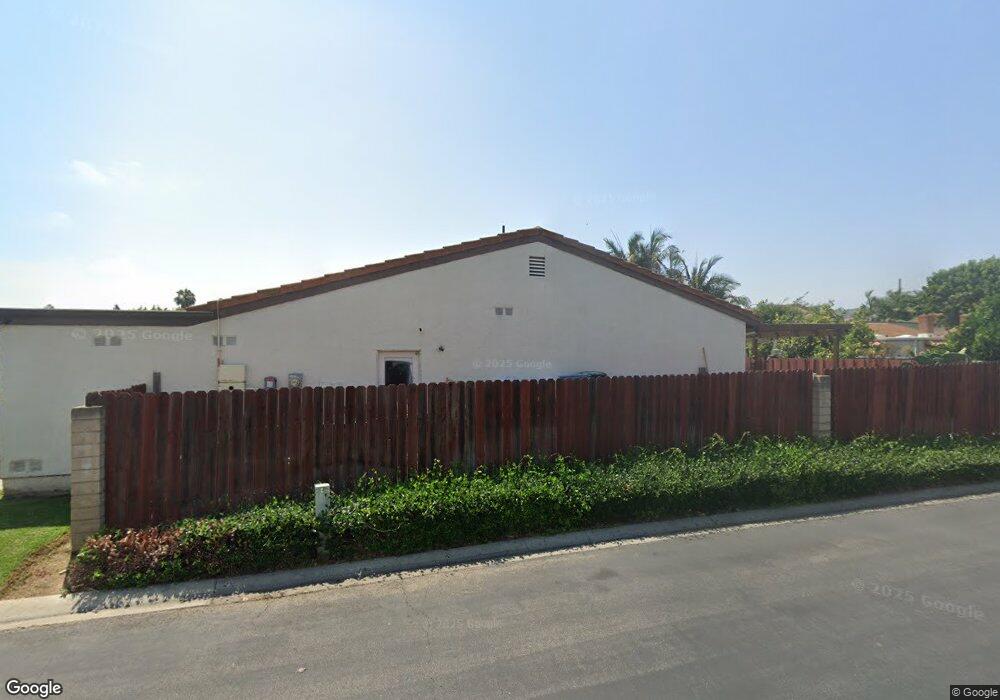
31135 Via San Vicente San Juan Capistrano, CA 92675
Estimated Value: $811,265 - $1,114,000
2
Beds
2
Baths
1,351
Sq Ft
$704/Sq Ft
Est. Value
About This Home
This home is located at 31135 Via San Vicente, San Juan Capistrano, CA 92675 and is currently estimated at $951,066, approximately $703 per square foot. 31135 Via San Vicente is a home located in Orange County with nearby schools including San Juan Elementary School, Marco Forster Middle School, and San Juan Hills High School.
Ownership History
Date
Name
Owned For
Owner Type
Purchase Details
Closed on
Feb 3, 2011
Sold by
Navarro Marcelino Pena and Velasco Maria Guadalupe
Bought by
Navarro Marcelino Pena and Velasco Maria Guadalupe
Current Estimated Value
Home Financials for this Owner
Home Financials are based on the most recent Mortgage that was taken out on this home.
Original Mortgage
$285,000
Outstanding Balance
$195,111
Interest Rate
4.79%
Mortgage Type
New Conventional
Estimated Equity
$755,955
Purchase Details
Closed on
Jan 19, 2006
Sold by
Pena Felipe and Norma G Pena V
Bought by
Pena Marcelino and Velasco Maria Guadalupe
Home Financials for this Owner
Home Financials are based on the most recent Mortgage that was taken out on this home.
Original Mortgage
$265,000
Interest Rate
6.21%
Mortgage Type
New Conventional
Purchase Details
Closed on
Oct 20, 1994
Sold by
Richards William H
Bought by
Pena Felipe and Norma G Pena V
Create a Home Valuation Report for This Property
The Home Valuation Report is an in-depth analysis detailing your home's value as well as a comparison with similar homes in the area
Home Values in the Area
Average Home Value in this Area
Purchase History
| Date | Buyer | Sale Price | Title Company |
|---|---|---|---|
| Navarro Marcelino Pena | -- | Lawyers Title | |
| Pena Marcelino | -- | Chicago Title Co | |
| Pena Felipe | $142,500 | Continental Lawyers Title Co |
Source: Public Records
Mortgage History
| Date | Status | Borrower | Loan Amount |
|---|---|---|---|
| Open | Navarro Marcelino Pena | $285,000 | |
| Closed | Pena Marcelino | $265,000 |
Source: Public Records
Tax History Compared to Growth
Tax History
| Year | Tax Paid | Tax Assessment Tax Assessment Total Assessment is a certain percentage of the fair market value that is determined by local assessors to be the total taxable value of land and additions on the property. | Land | Improvement |
|---|---|---|---|---|
| 2025 | $2,779 | $239,341 | $115,843 | $123,498 |
| 2024 | $2,779 | $234,649 | $113,572 | $121,077 |
| 2023 | $2,662 | $230,049 | $111,346 | $118,703 |
| 2022 | $2,342 | $225,539 | $109,163 | $116,376 |
| 2021 | $2,299 | $221,117 | $107,022 | $114,095 |
| 2020 | $2,279 | $218,850 | $105,924 | $112,926 |
| 2019 | $2,237 | $214,559 | $103,847 | $110,712 |
| 2018 | $2,197 | $210,352 | $101,810 | $108,542 |
| 2017 | $2,177 | $206,228 | $99,814 | $106,414 |
| 2016 | $2,137 | $202,185 | $97,857 | $104,328 |
| 2015 | $2,104 | $199,148 | $96,387 | $102,761 |
| 2014 | $2,066 | $195,247 | $94,498 | $100,749 |
Source: Public Records
Map
Nearby Homes
- 31261 Paseo Olivos
- 31121 Via Santo Tomas
- 31278 Calle San Juan Unit 12
- 31284 Calle San Juan Unit 14
- 30981 Via Mirador
- 26468 Calle San Antonio
- 31024 Calle San Diego Unit 94b
- 26447 Paseo Carmel Unit 11D
- 31377 Los Rios St Unit 64
- 30828 Calle Chueca
- 27381 Via Priorato
- 90 Plaza de Las Flores
- 31608 Los Rios St Unit 147
- 0 Aguacate Rd Unit 25558127
- 30532 Marbella Vista
- 31527 Aguacate Rd
- 27594 Starrise Ln
- 27703 Ortega Hwy Unit 13
- 27703 Ortega Hwy Unit 127
- 27591 Rolling Wood Ln
- 31141 Via San Vicente
- 26782 Via el Socorro
- 31142 Via San Vicente
- 31145 Via San Vicente
- 26772 Via el Socorro
- 26762 Via el Socorro
- 31151 Via San Vicente
- 31138 Via San Vicente
- 31162 Via San Vicente
- 26752 Via el Socorro
- 31161 Via San Vicente
- 31136 Via San Vicente
- 31166 Via San Vicente
- 31176 Calle San Pedro
- 31112 Via San Vicente
- 31172 Calle San Pedro
- 31132 Via San Vicente
- 26746 Via el Socorro
- 31126 Via San Vicente
- 31134 Via San Vicente