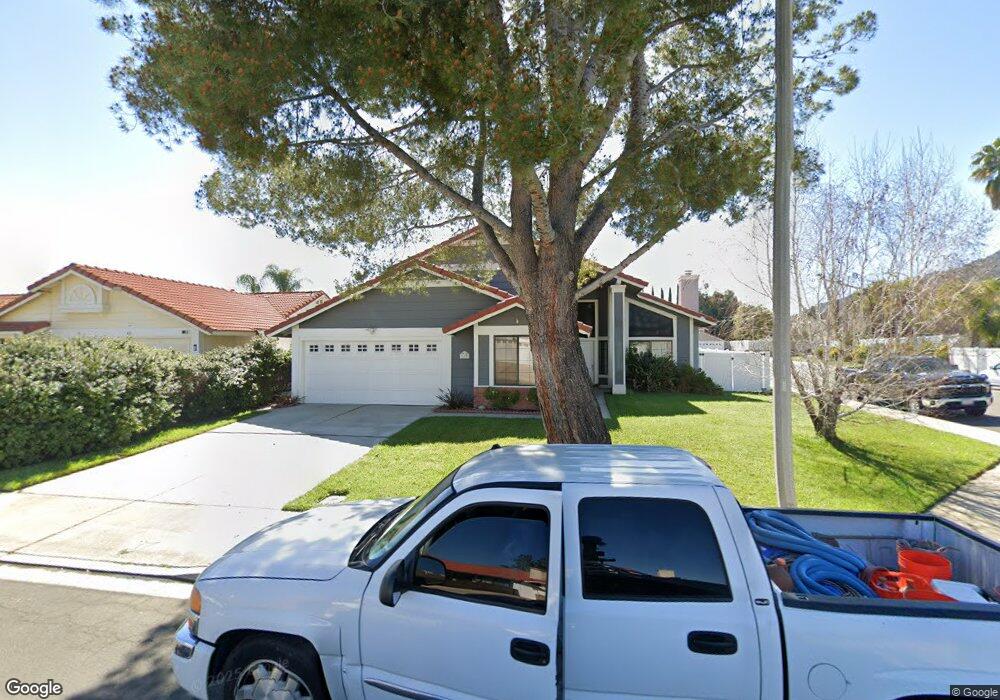
31139 Saho Ct Temecula, CA 92592
Estimated Value: $626,000 - $735,000
4
Beds
3
Baths
2,113
Sq Ft
$324/Sq Ft
Est. Value
About This Home
This home is located at 31139 Saho Ct, Temecula, CA 92592 and is currently estimated at $685,651, approximately $324 per square foot. 31139 Saho Ct is a home located in Riverside County with nearby schools including Temecula Luiseno Elementary, Erle Stanley Gardner Middle School, and Great Oak High School.
Ownership History
Date
Name
Owned For
Owner Type
Purchase Details
Closed on
Oct 21, 2020
Sold by
Petrone Joseph Thomas and Petrone Melissa Brea
Bought by
Petrone Joseph Thomas and Petrone Melissa Brea
Current Estimated Value
Home Financials for this Owner
Home Financials are based on the most recent Mortgage that was taken out on this home.
Original Mortgage
$250,000
Outstanding Balance
$221,956
Interest Rate
2.8%
Mortgage Type
New Conventional
Estimated Equity
$463,695
Purchase Details
Closed on
Aug 25, 2011
Sold by
United States Of America
Bought by
Petrone Joseph T and Petrone Melissa
Home Financials for this Owner
Home Financials are based on the most recent Mortgage that was taken out on this home.
Original Mortgage
$213,750
Interest Rate
4.26%
Mortgage Type
New Conventional
Purchase Details
Closed on
Apr 13, 2006
Sold by
Khachadoorian George and Khachadoorian Patricia
Bought by
Hall William Gregory and Hall Xiomara
Home Financials for this Owner
Home Financials are based on the most recent Mortgage that was taken out on this home.
Original Mortgage
$358,000
Interest Rate
6.12%
Mortgage Type
Purchase Money Mortgage
Purchase Details
Closed on
Jun 23, 2004
Sold by
Khachadoorian Patricia A
Bought by
Khachadoorian George and Khachadoorian Patricia
Home Financials for this Owner
Home Financials are based on the most recent Mortgage that was taken out on this home.
Original Mortgage
$320,000
Interest Rate
6.27%
Mortgage Type
New Conventional
Purchase Details
Closed on
Mar 14, 2003
Sold by
Johnston Janine R
Bought by
Khachadoorian Patricia A
Home Financials for this Owner
Home Financials are based on the most recent Mortgage that was taken out on this home.
Original Mortgage
$232,000
Interest Rate
7.71%
Purchase Details
Closed on
May 20, 2001
Sold by
Hall Xiomara
Bought by
United States Of America
Purchase Details
Closed on
Aug 22, 2000
Sold by
Johnston John R
Bought by
Johnston Janine R
Home Financials for this Owner
Home Financials are based on the most recent Mortgage that was taken out on this home.
Original Mortgage
$159,000
Interest Rate
8.11%
Purchase Details
Closed on
Jul 26, 2000
Sold by
Shughrou Michael A and Shughrou Nancy E
Bought by
Johnston Janine R
Home Financials for this Owner
Home Financials are based on the most recent Mortgage that was taken out on this home.
Original Mortgage
$159,000
Interest Rate
8.11%
Create a Home Valuation Report for This Property
The Home Valuation Report is an in-depth analysis detailing your home's value as well as a comparison with similar homes in the area
Purchase History
| Date | Buyer | Sale Price | Title Company |
|---|---|---|---|
| Petrone Joseph Thomas | -- | Ticor Title | |
| Petrone Joseph T | $225,000 | First American Title | |
| Hall William Gregory | $447,500 | Lawyers Title Co | |
| Khachadoorian George | -- | Multiple | |
| Khachadoorian Patricia A | $290,000 | Gateway Title Company | |
| United States Of America | $417,150 | Chicago Title Company | |
| Johnston Janine R | -- | Gateway Title Company | |
| Johnston Janine R | $199,000 | Gateway Title Company |
Source: Public Records
Mortgage History
| Date | Status | Borrower | Loan Amount |
|---|---|---|---|
| Open | Petrone Joseph Thomas | $250,000 | |
| Closed | Petrone Joseph T | $213,750 | |
| Previous Owner | Hall William Gregory | $358,000 | |
| Previous Owner | Khachadoorian George | $320,000 | |
| Previous Owner | Khachadoorian Patricia A | $232,000 | |
| Previous Owner | Johnston Janine R | $159,000 | |
| Closed | Johnston Janine R | $35,000 | |
| Closed | Khachadoorian Patricia A | $58,000 |
Source: Public Records
Tax History
| Year | Tax Paid | Tax Assessment Tax Assessment Total Assessment is a certain percentage of the fair market value that is determined by local assessors to be the total taxable value of land and additions on the property. | Land | Improvement |
|---|---|---|---|---|
| 2025 | $3,448 | $282,596 | $62,793 | $219,803 |
| 2023 | $3,448 | $271,624 | $60,355 | $211,269 |
| 2022 | $3,333 | $266,299 | $59,172 | $207,127 |
| 2021 | $3,257 | $261,078 | $58,012 | $203,066 |
| 2020 | $3,219 | $258,402 | $57,418 | $200,984 |
| 2019 | $3,169 | $253,337 | $56,293 | $197,044 |
| 2018 | $3,102 | $248,371 | $55,191 | $193,180 |
| 2017 | $3,044 | $243,502 | $54,109 | $189,393 |
| 2016 | $2,985 | $238,729 | $53,049 | $185,680 |
| 2015 | $2,930 | $235,145 | $52,253 | $182,892 |
| 2014 | $2,838 | $230,541 | $51,231 | $179,310 |
Source: Public Records
Map
Nearby Homes
- 31007 Shaba Cir
- 31155 Lahontan St
- 45374 Zuma Dr
- 31109 Shicali Ct
- 31348 Huron St
- 31352 Via Eduardo
- 31218 Comotilo Ct
- 31579 Mendocino Ct
- 45303 Esmerado Ct
- 45590 Alpine Place
- 31814 Murdock Ln
- 30945 Sawgrass Ct
- 30932 Greensboro Dr
- 45763 Via Nubes
- 45356 Via Nubes
- 45495 Peacock Place
- 31889 Red Pine Way
- 31564 Calle Canto
- 31937 Red Pine Way Unit 80
- 45187 Via Vela
- 31147 Saho Ct
- 31160 Lahontan St
- 31155 Saho Ct
- 31031 Shaba Cir
- 31168 Lahontan St
- 31176 Lahontan St
- 31152 Lahontan St
- 31134 Saho Ct
- 31163 Saho Ct
- 31142 Saho Ct
- 31023 Shaba Cir
- 31150 Saho Ct
- 31184 Lahontan St
- 31026 Shaba Cir
- 31144 Lahontan St
- 31015 Shaba Cir
- 31158 Saho Ct
- 31018 Shaba Cir
- 31192 Lahontan St
Your Personal Tour Guide
Ask me questions while you tour the home.