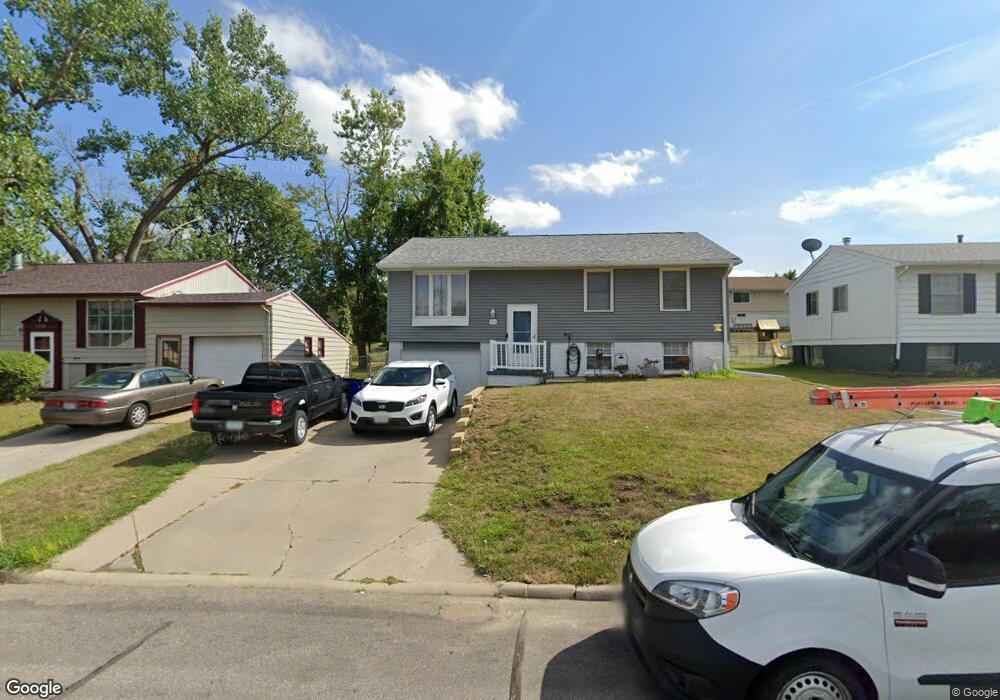
3115 Coral Ln SW Cedar Rapids, IA 52404
Estimated Value: $192,000 - $201,000
3
Beds
1
Bath
894
Sq Ft
$218/Sq Ft
Est. Value
About This Home
This home is located at 3115 Coral Ln SW, Cedar Rapids, IA 52404 and is currently estimated at $194,806, approximately $217 per square foot. 3115 Coral Ln SW is a home located in Linn County with nearby schools including Prairie Crest Elementary School, Prairie View Elementary School, and Prairie Ridge Elementary School.
Ownership History
Date
Name
Owned For
Owner Type
Purchase Details
Closed on
Jul 25, 2005
Sold by
Wachal Craig G
Bought by
Litzenberg Matthew R and Litzenberg Billi Jo
Current Estimated Value
Home Financials for this Owner
Home Financials are based on the most recent Mortgage that was taken out on this home.
Original Mortgage
$78,960
Outstanding Balance
$49,516
Interest Rate
8.95%
Mortgage Type
Fannie Mae Freddie Mac
Estimated Equity
$145,290
Purchase Details
Closed on
Oct 23, 2001
Sold by
Lash Tiffany L
Bought by
Wachal Craig G
Home Financials for this Owner
Home Financials are based on the most recent Mortgage that was taken out on this home.
Original Mortgage
$86,500
Interest Rate
6.8%
Purchase Details
Closed on
Jan 26, 1999
Sold by
Buresh John F and Buresh Jennifer L
Bought by
Lash Cory W and Lash Tiffany L
Home Financials for this Owner
Home Financials are based on the most recent Mortgage that was taken out on this home.
Original Mortgage
$86,759
Interest Rate
6.75%
Create a Home Valuation Report for This Property
The Home Valuation Report is an in-depth analysis detailing your home's value as well as a comparison with similar homes in the area
Home Values in the Area
Average Home Value in this Area
Purchase History
| Date | Buyer | Sale Price | Title Company |
|---|---|---|---|
| Litzenberg Matthew R | $112,500 | -- | |
| Wachal Craig G | $92,000 | -- | |
| Lash Cory W | $87,000 | -- |
Source: Public Records
Mortgage History
| Date | Status | Borrower | Loan Amount |
|---|---|---|---|
| Open | Litzenberg Matthew R | $78,960 | |
| Previous Owner | Wachal Craig G | $86,500 | |
| Previous Owner | Lash Cory W | $86,759 |
Source: Public Records
Tax History Compared to Growth
Tax History
| Year | Tax Paid | Tax Assessment Tax Assessment Total Assessment is a certain percentage of the fair market value that is determined by local assessors to be the total taxable value of land and additions on the property. | Land | Improvement |
|---|---|---|---|---|
| 2025 | $2,700 | $167,300 | $35,300 | $132,000 |
| 2024 | $2,856 | $162,200 | $32,400 | $129,800 |
| 2023 | $2,856 | $152,900 | $32,400 | $120,500 |
| 2022 | $2,618 | $137,800 | $26,800 | $111,000 |
| 2021 | $2,570 | $129,400 | $26,800 | $102,600 |
| 2020 | $2,570 | $121,500 | $24,000 | $97,500 |
| 2019 | $2,466 | $118,500 | $24,000 | $94,500 |
| 2018 | $2,394 | $118,500 | $24,000 | $94,500 |
| 2017 | $2,403 | $117,300 | $24,000 | $93,300 |
| 2016 | $2,403 | $111,000 | $24,000 | $87,000 |
| 2015 | $2,383 | $110,772 | $23,970 | $86,802 |
| 2014 | $2,196 | $115,340 | $23,970 | $91,370 |
| 2013 | $2,176 | $115,340 | $23,970 | $91,370 |
Source: Public Records
Map
Nearby Homes
- 3226 Bramble Rd SW
- 3205 33rd Ave SW
- 3221 Bramble Rd SW
- 3132 Pebble Dr SW
- 3405 Queen Dr SW
- 3009 Carriage Dr SW
- 3108 Huxley Ln SW
- 3619 King Dr SW
- 2812 29th Ave SW
- 3715 33rd Ave SW Unit 4.8 AC
- 3715 33rd Ave SW Unit 5.8 AC
- 3715 33rd Ave SW Unit 1 AC
- 3737 Monarch Dr SW
- 2521 Radcliffe Ct SW
- 3302 Sokol Ln SW
- 3406 Sokol Ln SW
- 3845 37th Ave SW Unit B
- 3424 Sokol Ln SW
- 3502 Sokol Ln SW
- 3508 Sokol Ln SW
- 3111 Coral Ln SW
- 3119 Coral Ln SW
- 3114 33rd Ave SW
- 3118 33rd Ave SW
- 3110 33rd Ave SW
- 3123 Coral Ln SW
- 3107 Coral Ln SW
- 3122 33rd Ave SW
- 3106 33rd Ave SW
- 3110 Coral Ln SW
- 3118 Coral Ln SW
- 3127 Coral Ln SW
- 3103 Coral Ln SW
- 3106 Coral Ln SW
- 3122 Coral Ln SW
- 3126 33rd Ave SW
- 3102 33rd Ave SW
- 3102 Coral Ln SW
- 3126 Coral Ln SW
- 3131 Coral Ln SW