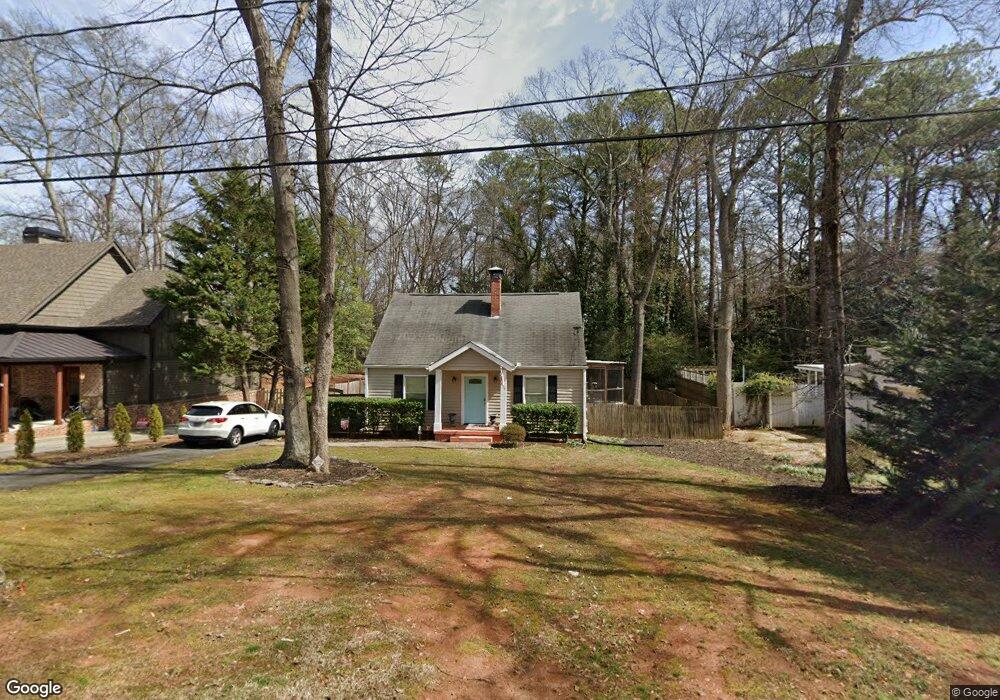
3115 Wills St SE Smyrna, GA 30080
Estimated Value: $459,747 - $549,000
4
Beds
2
Baths
1,726
Sq Ft
$296/Sq Ft
Est. Value
About This Home
This home is located at 3115 Wills St SE, Smyrna, GA 30080 and is currently estimated at $510,687, approximately $295 per square foot. 3115 Wills St SE is a home located in Cobb County with nearby schools including Smyrna Elementary School, Campbell Middle School, and Campbell High School.
Ownership History
Date
Name
Owned For
Owner Type
Purchase Details
Closed on
Jun 27, 2005
Sold by
Kroll David E and Martha N
Bought by
Sheehan Kelley E
Current Estimated Value
Home Financials for this Owner
Home Financials are based on the most recent Mortgage that was taken out on this home.
Original Mortgage
$203,200
Outstanding Balance
$104,782
Interest Rate
5.57%
Mortgage Type
New Conventional
Estimated Equity
$405,905
Purchase Details
Closed on
Mar 29, 2001
Sold by
Kasmar Paul A
Bought by
Kroll David E and Kroll Martha K
Home Financials for this Owner
Home Financials are based on the most recent Mortgage that was taken out on this home.
Original Mortgage
$198,550
Interest Rate
7.11%
Mortgage Type
New Conventional
Purchase Details
Closed on
Sep 26, 1997
Sold by
Eubanks D L and Eubanks Mary D
Bought by
Kasmar Paige
Create a Home Valuation Report for This Property
The Home Valuation Report is an in-depth analysis detailing your home's value as well as a comparison with similar homes in the area
Home Values in the Area
Average Home Value in this Area
Purchase History
| Date | Buyer | Sale Price | Title Company |
|---|---|---|---|
| Sheehan Kelley E | $254,000 | -- | |
| Kroll David E | $209,000 | -- | |
| Kasmar Paige | $86,500 | -- |
Source: Public Records
Mortgage History
| Date | Status | Borrower | Loan Amount |
|---|---|---|---|
| Open | Sheehan Kelley E | $203,200 | |
| Previous Owner | Kroll David E | $198,550 | |
| Closed | Kasmar Paige | -- |
Source: Public Records
Tax History Compared to Growth
Tax History
| Year | Tax Paid | Tax Assessment Tax Assessment Total Assessment is a certain percentage of the fair market value that is determined by local assessors to be the total taxable value of land and additions on the property. | Land | Improvement |
|---|---|---|---|---|
| 2025 | $522 | $238,528 | $50,000 | $188,528 |
| 2024 | $522 | $238,528 | $50,000 | $188,528 |
| 2023 | $370 | $150,528 | $40,000 | $110,528 |
| 2022 | $522 | $150,528 | $40,000 | $110,528 |
| 2021 | $539 | $125,380 | $40,000 | $85,380 |
| 2020 | $2,719 | $125,380 | $40,000 | $85,380 |
| 2019 | $2,470 | $112,284 | $28,000 | $84,284 |
| 2018 | $2,070 | $91,284 | $28,000 | $63,284 |
| 2017 | $1,965 | $91,284 | $28,000 | $63,284 |
| 2016 | $1,667 | $75,520 | $28,000 | $47,520 |
| 2015 | $1,706 | $75,520 | $28,000 | $47,520 |
| 2014 | $1,649 | $71,736 | $0 | $0 |
Source: Public Records
Map
Nearby Homes
- 1460 Memory Ln SE
- 3018 Montclair Cir SE Unit 57
- 3028 Montclair Cir SE
- 1483 Collier Dr SE
- 3324 Pretty Branch Dr SE
- 3064 Montclair Cir SE
- 1652 Mosaic Way
- 1303 Vinings Forest Ln SE
- 1203 Vinings Forest Ln SE Unit 12
- 1582 Mosaic Way Unit 1582
- 3211 Collier Gate Ct SE
- 3086 Nichols St SE
- 2861 Bernard Ln SE
- 812 Vinings Forest Ln SE Unit 812
- 3133 Dunton St SE
- 1552 Mosaic Way
- 1560 Mosaic Way
- 3107 Wills St SE
- 3127 Wills St SE
- 3101 Wills St SE Unit None
- 3101 Wills St SE
- 3116 Wills St SE
- 0 Wills St Unit 7388833
- 0 Wills St Unit 7380894
- 0 Wills St Unit 7286558
- 0 Wills St Unit 7160683
- 0 Wills St Unit 8816078
- 0 Wills St Unit 8306884
- 0 Wills St Unit 8928068
- 3108 Wills St SE
- 3100 Wills St SE
- 3138 Wills St SE
- 3094 Wills St SE
- 3085 Wills St SE
- 3132 Northview Place SE
- 1375 Stonegate Ln SE
- 3140 Northview Place SE