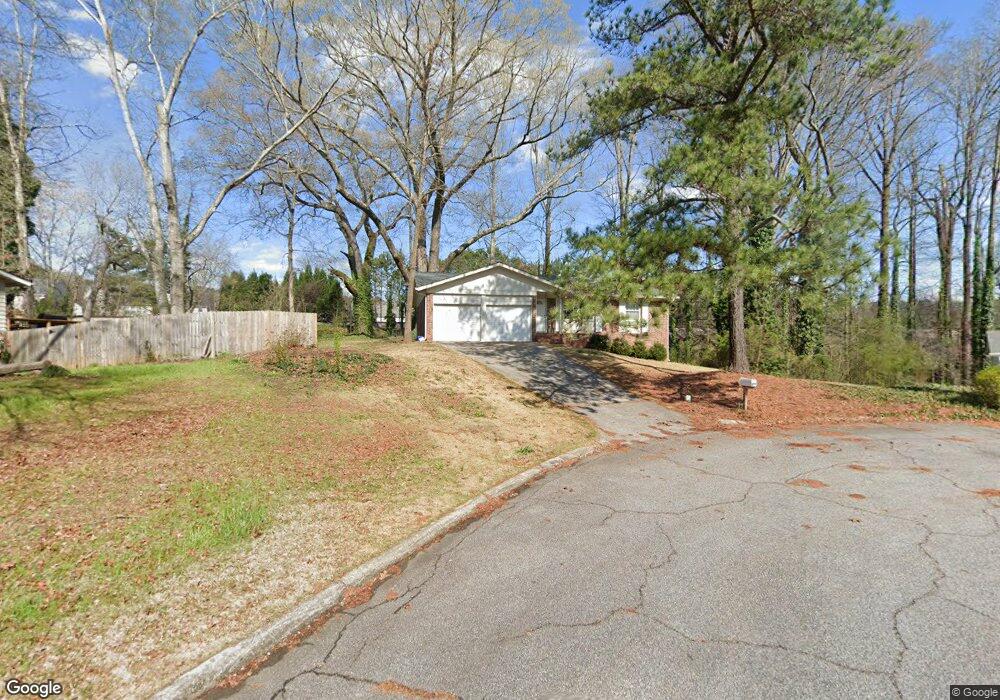
3116 Ann Rd SE Smyrna, GA 30080
Estimated Value: $389,000 - $428,818
3
Beds
2
Baths
1,360
Sq Ft
$301/Sq Ft
Est. Value
About This Home
This home is located at 3116 Ann Rd SE, Smyrna, GA 30080 and is currently estimated at $408,955, approximately $300 per square foot. 3116 Ann Rd SE is a home located in Cobb County with nearby schools including Teasley Elementary School, Campbell Middle School, and Campbell High School.
Ownership History
Date
Name
Owned For
Owner Type
Purchase Details
Closed on
Jan 31, 2007
Sold by
Pruess David and Pruess Kimberly
Bought by
Hayllar Russell M
Current Estimated Value
Home Financials for this Owner
Home Financials are based on the most recent Mortgage that was taken out on this home.
Original Mortgage
$160,000
Outstanding Balance
$95,403
Interest Rate
6.17%
Mortgage Type
New Conventional
Estimated Equity
$313,552
Purchase Details
Closed on
Jun 20, 2006
Sold by
Peymax Properties Inc
Bought by
Preuss David and Oconnor Joseph
Home Financials for this Owner
Home Financials are based on the most recent Mortgage that was taken out on this home.
Original Mortgage
$120,000
Interest Rate
6.55%
Mortgage Type
New Conventional
Purchase Details
Closed on
Mar 30, 2006
Sold by
Helton Hms Llc
Bought by
Peymax Prop Inc
Home Financials for this Owner
Home Financials are based on the most recent Mortgage that was taken out on this home.
Original Mortgage
$115,000
Interest Rate
6.29%
Create a Home Valuation Report for This Property
The Home Valuation Report is an in-depth analysis detailing your home's value as well as a comparison with similar homes in the area
Home Values in the Area
Average Home Value in this Area
Purchase History
| Date | Buyer | Sale Price | Title Company |
|---|---|---|---|
| Hayllar Russell M | $200,000 | -- | |
| Preuss David | -- | -- | |
| Preuss David | $150,000 | -- | |
| Peymax Prop Inc | $110,000 | -- |
Source: Public Records
Mortgage History
| Date | Status | Borrower | Loan Amount |
|---|---|---|---|
| Open | Hayllar Russell M | $160,000 | |
| Previous Owner | Preuss David | $120,000 | |
| Previous Owner | Preuss David | $20,000 | |
| Previous Owner | Peymax Prop Inc | $115,000 |
Source: Public Records
Tax History Compared to Growth
Tax History
| Year | Tax Paid | Tax Assessment Tax Assessment Total Assessment is a certain percentage of the fair market value that is determined by local assessors to be the total taxable value of land and additions on the property. | Land | Improvement |
|---|---|---|---|---|
| 2025 | $3,817 | $140,548 | $52,000 | $88,548 |
| 2024 | $3,817 | $140,548 | $52,000 | $88,548 |
| 2023 | $3,767 | $138,688 | $44,000 | $94,688 |
| 2022 | $2,925 | $106,896 | $24,000 | $82,896 |
| 2021 | $2,939 | $106,896 | $24,000 | $82,896 |
| 2020 | $2,665 | $96,952 | $24,000 | $72,952 |
| 2019 | $2,665 | $96,952 | $24,000 | $72,952 |
| 2018 | $2,129 | $77,448 | $24,000 | $53,448 |
| 2017 | $1,597 | $61,924 | $18,000 | $43,924 |
| 2016 | $1,597 | $61,924 | $18,000 | $43,924 |
| 2015 | $1,635 | $61,924 | $18,000 | $43,924 |
| 2014 | $1,260 | $57,132 | $0 | $0 |
Source: Public Records
Map
Nearby Homes
- 2700 Chestnut Willow Walk Unit 46
- 1904 Country Park Dr SE
- 1108 Country Park Dr SE
- 1142 Drewsbury Ct SE
- 2308 Country Park Dr SE
- 1405 Cumberland Ct SE Unit 1405
- 2621 Camphor Crossing Unit 87
- 2736 Chestnut Willow Walk Unit 55
- 2740 Chestnut Willow Walk Unit 56
- 907 Country Park Dr SE
- 1307 Cumberland Ct SE
- 1502 Countryside Place SE
- Remerton Elite Plan at Rowan Walk - Maple Collection
- 2617 Camphor Crossing SE Unit 88
- 2605 Camphor Crossing SE Unit 91
- Chestatee Plan at Rowan Walk - Cottages Collection
- 2613 Camphor Crossing SE
- 2629 Camphor Crossing SE
- Tallulah Plan at Rowan Walk - Cottages Collection
- 2613 Camphor Crossing SE Unit 89
- 3112 Ann Rd SE
- 3120 Ann Rd SE
- 3106 Ann Rd SE
- 1107 Drewsbury Ct SE Unit 2
- 1109 Drewsbury Ct SE Unit 2B
- 1111 Drewsbury Ct SE
- 3130 Ann Rd SE
- 1113 Drewsbury Ct SE
- 1105 Drewsbury Ct SE
- 3125 Ann Rd SE
- 3109 Ann Rd SE
- 1103 Drewsbury Ct SE Unit 2
- 1101 Drewsbury Ct SE
- 3142 Ann Rd SE
- 1112 Drewsbury Ct SE
- 1175 Drewsbury Ct SE
- 1110 Drewsbury Ct SE
- 1108 Drewsbury Ct SE
- 1106 Drewsbury Ct SE
- 1116 Drewsbury Ct SE