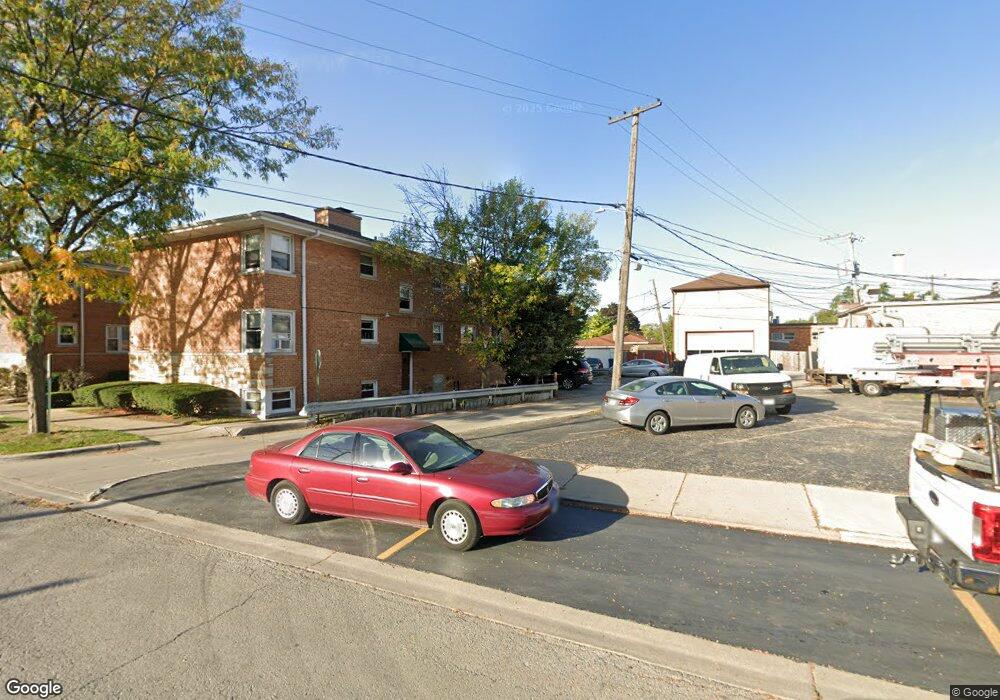
3116 Calwagner St Unit 31161 Franklin Park, IL 60131
Estimated Value: $119,000 - $153,316
1
Bed
--
Bath
650
Sq Ft
$218/Sq Ft
Est. Value
About This Home
This home is located at 3116 Calwagner St Unit 31161, Franklin Park, IL 60131 and is currently estimated at $141,829, approximately $218 per square foot. 3116 Calwagner St Unit 31161 is a home located in Cook County with nearby schools including Passow Elementary School, Hester Jr High School, and East Leyden High School.
Ownership History
Date
Name
Owned For
Owner Type
Purchase Details
Closed on
Mar 17, 2018
Sold by
Nguyen Chinh and Nguyen Khang
Bought by
Kcht Llc
Current Estimated Value
Purchase Details
Closed on
Mar 31, 2015
Sold by
Genson David
Bought by
Nguyen Khang D and Nguyen Toan D
Purchase Details
Closed on
Jul 15, 2008
Sold by
Deutsche Bank National Trust Co
Bought by
Brown Shawn
Purchase Details
Closed on
Mar 27, 2006
Sold by
Sztylko Maciej
Bought by
Zholudyev Volodymyr
Home Financials for this Owner
Home Financials are based on the most recent Mortgage that was taken out on this home.
Original Mortgage
$122,900
Interest Rate
11.25%
Mortgage Type
Unknown
Purchase Details
Closed on
Oct 9, 2003
Sold by
Paolinette Stella
Bought by
Sztylko Maciej
Home Financials for this Owner
Home Financials are based on the most recent Mortgage that was taken out on this home.
Original Mortgage
$104,500
Interest Rate
5.25%
Mortgage Type
Unknown
Create a Home Valuation Report for This Property
The Home Valuation Report is an in-depth analysis detailing your home's value as well as a comparison with similar homes in the area
Home Values in the Area
Average Home Value in this Area
Purchase History
| Date | Buyer | Sale Price | Title Company |
|---|---|---|---|
| Kcht Llc | -- | None Available | |
| Nguyen Khang D | $53,000 | Stewart Title | |
| Brown Shawn | $80,000 | First American Title | |
| Zholudyev Volodymyr | $135,000 | Multiple | |
| Sztylko Maciej | $110,000 | Alliance Title |
Source: Public Records
Mortgage History
| Date | Status | Borrower | Loan Amount |
|---|---|---|---|
| Previous Owner | Zholudyev Volodymyr | $122,900 | |
| Previous Owner | Sztylko Maciej | $104,500 |
Source: Public Records
Tax History Compared to Growth
Tax History
| Year | Tax Paid | Tax Assessment Tax Assessment Total Assessment is a certain percentage of the fair market value that is determined by local assessors to be the total taxable value of land and additions on the property. | Land | Improvement |
|---|---|---|---|---|
| 2024 | $2,995 | $9,754 | $725 | $9,029 |
| 2023 | $3,091 | $9,754 | $725 | $9,029 |
| 2022 | $3,091 | $9,754 | $725 | $9,029 |
| 2021 | $1,855 | $4,683 | $523 | $4,160 |
| 2020 | $1,765 | $4,683 | $523 | $4,160 |
| 2019 | $1,833 | $5,290 | $523 | $4,767 |
| 2018 | $1,718 | $4,258 | $442 | $3,816 |
| 2017 | $1,693 | $4,258 | $442 | $3,816 |
| 2016 | $1,574 | $4,258 | $442 | $3,816 |
| 2015 | $1,933 | $4,951 | $402 | $4,549 |
| 2014 | $1,882 | $4,951 | $402 | $4,549 |
| 2013 | $1,745 | $4,951 | $402 | $4,549 |
Source: Public Records
Map
Nearby Homes
- 3114 Calwagner St Unit 31141
- 3114 Calwagner St Unit G1W
- 3116 Calwagner St Unit 31162
- 3114 Calwagner St Unit G1E
- 3116 Calwagner St Unit 31161
- 3114 Calwagner St Unit 31141
- 3114 Calwagner St Unit 31142
- 3114 Calwagner St Unit 31142
- 3116 Calwagner St Unit 31162
- 3114 Calwagner St Unit 1-W
- 3114 Calwagner St Unit 2W
- 3116 Calwagner St Unit 2W
- 3114 Calwagner St Unit 2-E
- 3114 Calwagner St Unit 1E
- 3116 Calwagner St Unit 1W
- 3116 Calwagner St Unit GW
- 3114 Calwagner St Unit GE
- 3112 Calwagner St Unit GW
- 3112 Calwagner St Unit 2E