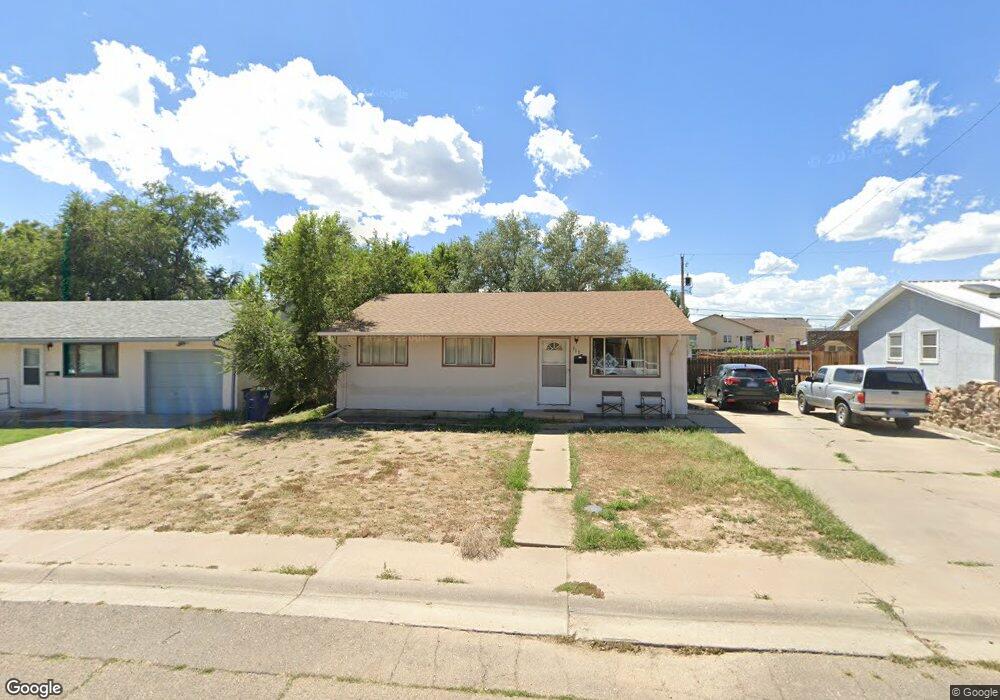
3117 Skyview Ave Pueblo, CO 81008
Skyview NeighborhoodEstimated Value: $189,078 - $214,000
3
Beds
1
Bath
936
Sq Ft
$217/Sq Ft
Est. Value
About This Home
This home is located at 3117 Skyview Ave, Pueblo, CO 81008 and is currently estimated at $203,020, approximately $216 per square foot. 3117 Skyview Ave is a home located in Pueblo County with nearby schools including Morton Elementary School, Risley International Academy of Innovation, and Centennial High School.
Ownership History
Date
Name
Owned For
Owner Type
Purchase Details
Closed on
Sep 19, 2013
Sold by
U S Bank National Association
Bought by
Silver Lining Holdings Llc
Current Estimated Value
Purchase Details
Closed on
Jul 16, 2007
Sold by
Fesmire Andrea L
Bought by
Roberson James
Home Financials for this Owner
Home Financials are based on the most recent Mortgage that was taken out on this home.
Original Mortgage
$85,405
Interest Rate
9.65%
Mortgage Type
Stand Alone First
Purchase Details
Closed on
May 15, 2000
Sold by
Hergert Erin A
Bought by
Fesmire Andrea L
Purchase Details
Closed on
Dec 31, 1997
Sold by
Mazza Erin H
Bought by
Hergert Erin A
Purchase Details
Closed on
Sep 18, 1995
Sold by
Osborn Randy S + Connie J
Bought by
Mazza Erin H
Purchase Details
Closed on
May 21, 1993
Sold by
Young Linda A
Bought by
Osborn Randy S + Connie J
Purchase Details
Closed on
Aug 8, 1977
Sold by
Young Owen Albert + Linda A
Bought by
Young Linda A
Create a Home Valuation Report for This Property
The Home Valuation Report is an in-depth analysis detailing your home's value as well as a comparison with similar homes in the area
Home Values in the Area
Average Home Value in this Area
Purchase History
| Date | Buyer | Sale Price | Title Company |
|---|---|---|---|
| Silver Lining Holdings Llc | $43,000 | Bay National Title Co | |
| Roberson James | $89,900 | Multiple | |
| Fesmire Andrea L | $77,000 | -- | |
| Hergert Erin A | -- | -- | |
| Mazza Erin H | $52,000 | -- | |
| Osborn Randy S + Connie J | $41,000 | -- | |
| Young Linda A | -- | -- |
Source: Public Records
Mortgage History
| Date | Status | Borrower | Loan Amount |
|---|---|---|---|
| Previous Owner | Roberson James | $85,405 |
Source: Public Records
Tax History Compared to Growth
Tax History
| Year | Tax Paid | Tax Assessment Tax Assessment Total Assessment is a certain percentage of the fair market value that is determined by local assessors to be the total taxable value of land and additions on the property. | Land | Improvement |
|---|---|---|---|---|
| 2024 | $803 | $8,150 | -- | -- |
| 2023 | $811 | $11,840 | $1,210 | $10,630 |
| 2022 | $804 | $8,100 | $1,250 | $6,850 |
| 2021 | $830 | $8,340 | $1,290 | $7,050 |
| 2020 | $679 | $8,340 | $1,290 | $7,050 |
| 2019 | $680 | $6,737 | $894 | $5,843 |
| 2018 | $528 | $5,831 | $900 | $4,931 |
| 2017 | $534 | $5,831 | $900 | $4,931 |
| 2016 | $520 | $5,725 | $995 | $4,730 |
| 2015 | $518 | $5,725 | $995 | $4,730 |
| 2014 | $258 | $5,692 | $995 | $4,697 |
Source: Public Records
Map
Nearby Homes
- TBD W 31st St
- 2901 Denver Blvd
- 3215 Baltimore Ave
- 2915 Cheyenne Ave
- 2920 Cheyenne Ave
- 3223 Baltimore Ave Unit 3225
- 2800 Wills Blvd
- 3216 Baltimore Ave
- 3407 Baltimore Ave
- 3210 Shalimar Terrace
- 3005 W 28th St
- 3214 Shalimar Terrace
- 2803 Baltimore Ave
- 2110 Northmoor Terrace Unit 2
- 2108 Northmoor Terrace
- TBD Adrian Ave
- 1810 W 32nd St
- 3230 Shalimar Terrace
- Lot 3 Kachina Dr
- 3217 Colfax Ave
- 3119 Skyview Ave
- 3115 Skyview Ave
- 3116 Norwich Ave
- 3121 Skyview Ave
- 3113 Skyview Ave
- 3118 Norwich Ave
- 3114 Norwich Ave
- 3120 Norwich Ave
- 3112 Norwich Ave
- 3118 Skyview Ave
- 3116 Skyview Ave
- 3111 Skyview Ave
- 3123 Skyview Ave
- 3120 Skyview Ave
- 3112 Skyview Ave
- 3110 Norwich Ave
- 3122 Skyview Ave
- 3109 Skyview Ave
- 3110 Skyview Ave
- 3125 Skyview Ave