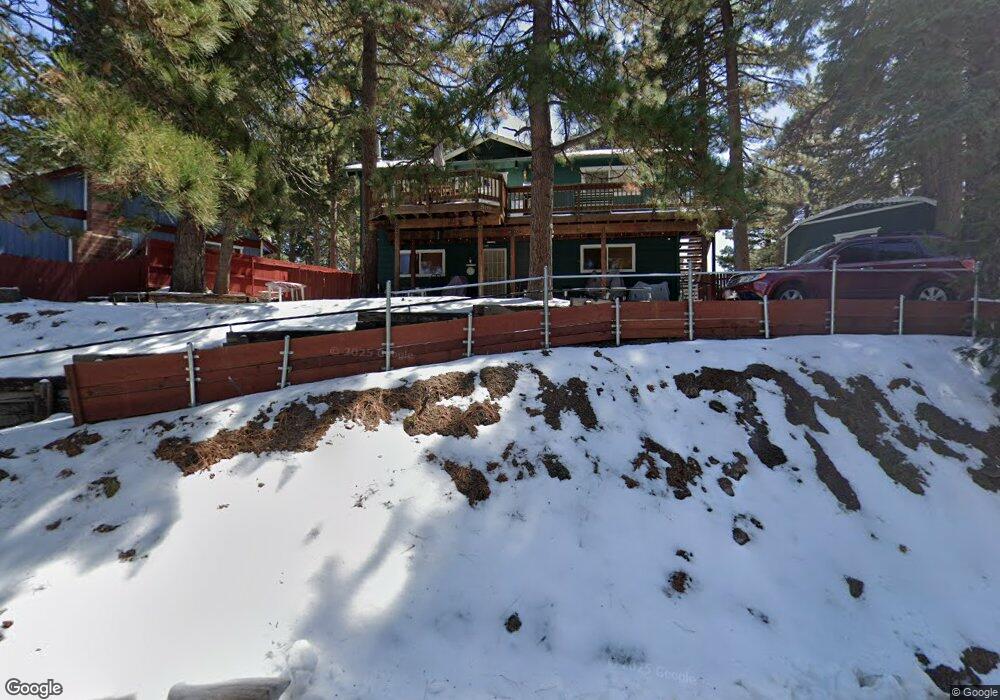
31175 All View Dr Running Springs, CA 92382
Estimated Value: $449,852 - $500,000
4
Beds
2
Baths
912
Sq Ft
$523/Sq Ft
Est. Value
About This Home
This home is located at 31175 All View Dr, Running Springs, CA 92382 and is currently estimated at $476,963, approximately $522 per square foot. 31175 All View Dr is a home with nearby schools including Charles Hoffman Elementary School, Mary P. Henck Intermediate School, and Rim Of The World Senior High School.
Ownership History
Date
Name
Owned For
Owner Type
Purchase Details
Closed on
Feb 9, 2021
Sold by
Lockard Fred L and Lockard Susan
Bought by
Lockard Fredrick L and Lockard Susan E
Current Estimated Value
Purchase Details
Closed on
Apr 24, 2007
Sold by
Lockard Fred L
Bought by
Lockard Fred L and Lockard Susan
Home Financials for this Owner
Home Financials are based on the most recent Mortgage that was taken out on this home.
Original Mortgage
$291,200
Interest Rate
6.11%
Mortgage Type
New Conventional
Purchase Details
Closed on
Jan 6, 2006
Sold by
Plymesser Joseph A
Bought by
Lockard Fred L and Johnson Susan
Home Financials for this Owner
Home Financials are based on the most recent Mortgage that was taken out on this home.
Original Mortgage
$226,344
Interest Rate
6.21%
Mortgage Type
VA
Create a Home Valuation Report for This Property
The Home Valuation Report is an in-depth analysis detailing your home's value as well as a comparison with similar homes in the area
Home Values in the Area
Average Home Value in this Area
Purchase History
| Date | Buyer | Sale Price | Title Company |
|---|---|---|---|
| Lockard Fredrick L | -- | None Available | |
| Lockard Fred L | -- | Orange Coast Title | |
| Lockard Fred L | $314,000 | None Available |
Source: Public Records
Mortgage History
| Date | Status | Borrower | Loan Amount |
|---|---|---|---|
| Previous Owner | Lockard Fred L | $291,200 | |
| Previous Owner | Lockard Fred L | $226,344 |
Source: Public Records
Tax History Compared to Growth
Tax History
| Year | Tax Paid | Tax Assessment Tax Assessment Total Assessment is a certain percentage of the fair market value that is determined by local assessors to be the total taxable value of land and additions on the property. | Land | Improvement |
|---|---|---|---|---|
| 2025 | $3,420 | $428,494 | $51,419 | $377,075 |
| 2024 | $3,420 | $420,092 | $50,411 | $369,681 |
| 2023 | $5,066 | $411,855 | $49,423 | $362,432 |
| 2022 | $4,698 | $381,000 | $76,000 | $305,000 |
| 2021 | $3,842 | $306,000 | $61,000 | $245,000 |
| 2020 | $3,458 | $270,900 | $54,600 | $216,300 |
| 2019 | $3,340 | $263,000 | $53,000 | $210,000 |
| 2018 | $2,808 | $227,500 | $46,000 | $181,500 |
| 2017 | $2,627 | $211,600 | $42,800 | $168,800 |
| 2016 | $2,459 | $199,600 | $40,400 | $159,200 |
| 2015 | $2,339 | $188,300 | $38,100 | $150,200 |
| 2014 | $2,240 | $179,300 | $36,300 | $143,000 |
Source: Public Records
Map
Nearby Homes
- 2113 Spring Oak Dr
- 31162 All View Dr
- 2212 Spring Oak Dr
- 31120 Mountain Oak Dr
- 2236 Spring Oak Dr
- 30997 Wild Oak Dr
- 31308 Firwood Dr
- 30955 Scenic Way
- 31140 Summit Dr
- 2402 Spring Oak Dr
- 2458 Spring Oak Dr
- 30904 Live Oak Dr
- 31345 Cedarwood Dr
- 30951 Glen Oak Dr
- 31354 Overhill Dr
- 1993 Willow Dr
- 2313 Spring Oak Dr
- 31321 Circle View Dr
- 31377 Overhill Dr
- 31124 All View Dr
- 31177 Allview Dr
- 31162 Outer Highway 18
- 31172 Outer Highway 18
- 31181 All View Dr
- 31176 All View Dr
- 31140 Outer Highway 18
- 31183 All View Dr
- 31145 Old Highway 18 N
- 31180 All View Dr
- 31180 Outer Highway 18 N
- 31182 All View Dr
- 31187 All View Dr
- 31188 Outer Highway 18
- 31191 All View Dr
- 31133 Outer Highway 18
- 31192 All View Dr
- 31194 Outer Highway 18 Unit B
- 31194 Outer Highway 18
- 31194 Old Highway 18 N
- 31194 Outer Highway 18 N