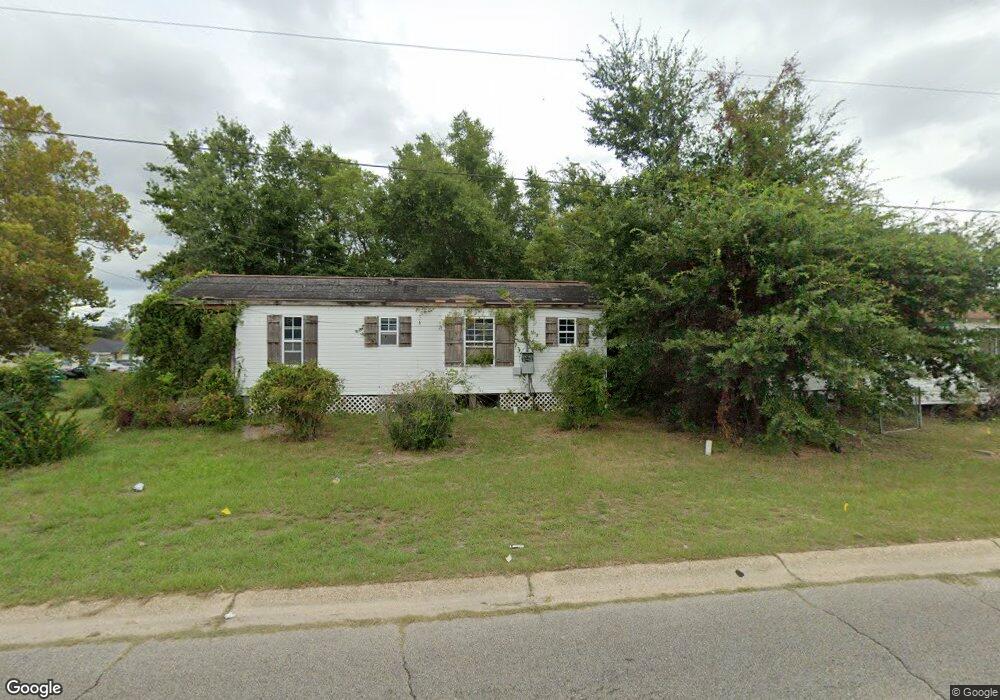
3118 20th St Gulfport, MS 39501
Central Gulfport NeighborhoodEstimated Value: $94,000 - $113,000
--
Bed
--
Bath
567
Sq Ft
$183/Sq Ft
Est. Value
About This Home
This home is located at 3118 20th St, Gulfport, MS 39501 and is currently estimated at $103,667, approximately $182 per square foot. 3118 20th St is a home located in Harrison County with nearby schools including West Elementary School, Gulfport Central Middle School, and Gulfport High School.
Ownership History
Date
Name
Owned For
Owner Type
Purchase Details
Closed on
Dec 4, 2020
Sold by
Ellot Homes Llc
Bought by
Her Michael and Xiong Khue
Current Estimated Value
Home Financials for this Owner
Home Financials are based on the most recent Mortgage that was taken out on this home.
Original Mortgage
$325,221
Outstanding Balance
$290,060
Interest Rate
2.8%
Mortgage Type
VA
Estimated Equity
-$186,393
Purchase Details
Closed on
Nov 22, 2020
Sold by
Caldwell Anita L
Bought by
Obi Denise
Home Financials for this Owner
Home Financials are based on the most recent Mortgage that was taken out on this home.
Original Mortgage
$325,221
Outstanding Balance
$290,060
Interest Rate
2.8%
Mortgage Type
VA
Estimated Equity
-$186,393
Create a Home Valuation Report for This Property
The Home Valuation Report is an in-depth analysis detailing your home's value as well as a comparison with similar homes in the area
Home Values in the Area
Average Home Value in this Area
Purchase History
| Date | Buyer | Sale Price | Title Company |
|---|---|---|---|
| Her Michael | -- | None Available | |
| Obi Denise | -- | None Available |
Source: Public Records
Mortgage History
| Date | Status | Borrower | Loan Amount |
|---|---|---|---|
| Open | Her Michael | $325,221 |
Source: Public Records
Tax History Compared to Growth
Tax History
| Year | Tax Paid | Tax Assessment Tax Assessment Total Assessment is a certain percentage of the fair market value that is determined by local assessors to be the total taxable value of land and additions on the property. | Land | Improvement |
|---|---|---|---|---|
| 2024 | $1,550 | $2,274 | $0 | $0 |
| 2023 | $802 | $5,931 | $0 | $0 |
| 2022 | $802 | $5,931 | $0 | $0 |
| 2021 | $802 | $5,931 | $0 | $0 |
| 2020 | $780 | $5,766 | $0 | $0 |
| 2019 | $780 | $5,766 | $0 | $0 |
| 2018 | $780 | $5,766 | $0 | $0 |
| 2017 | $780 | $5,766 | $0 | $0 |
| 2015 | $745 | $5,505 | $0 | $0 |
| 2014 | -- | $3,671 | $0 | $0 |
| 2013 | -- | $3,670 | $281 | $3,390 |
Source: Public Records
Map
Nearby Homes