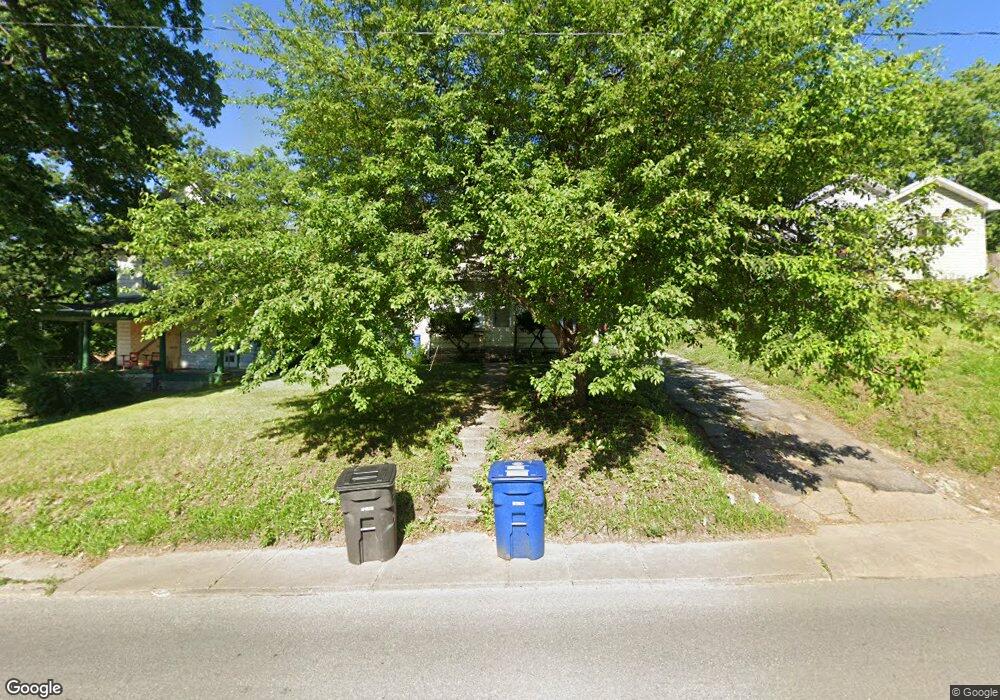
3118 6th Ave Des Moines, IA 50313
Oak Park NeighborhoodEstimated Value: $115,000 - $166,000
2
Beds
1
Bath
996
Sq Ft
$137/Sq Ft
Est. Value
About This Home
This home is located at 3118 6th Ave, Des Moines, IA 50313 and is currently estimated at $136,269, approximately $136 per square foot. 3118 6th Ave is a home located in Polk County with nearby schools including Oak Park Elementary School, Harding Middle School, and North High School.
Ownership History
Date
Name
Owned For
Owner Type
Purchase Details
Closed on
Aug 28, 2005
Sold by
Leff Scott N and Leff Traci A
Bought by
Flores Rubin Silva
Current Estimated Value
Home Financials for this Owner
Home Financials are based on the most recent Mortgage that was taken out on this home.
Original Mortgage
$3,000
Outstanding Balance
$1,592
Interest Rate
5.82%
Mortgage Type
Purchase Money Mortgage
Estimated Equity
$134,677
Purchase Details
Closed on
Jul 22, 2004
Sold by
Hud
Bought by
Leff Scott and Leff Traci
Purchase Details
Closed on
Aug 12, 2000
Sold by
Peterson Donald M and Peterson Marilyn J
Bought by
Ortiz Javier and Lozano Amparo
Home Financials for this Owner
Home Financials are based on the most recent Mortgage that was taken out on this home.
Original Mortgage
$71,907
Interest Rate
8.16%
Mortgage Type
FHA
Create a Home Valuation Report for This Property
The Home Valuation Report is an in-depth analysis detailing your home's value as well as a comparison with similar homes in the area
Home Values in the Area
Average Home Value in this Area
Purchase History
| Date | Buyer | Sale Price | Title Company |
|---|---|---|---|
| Flores Rubin Silva | $71,500 | -- | |
| Leff Scott | -- | -- | |
| Ortiz Javier | $72,000 | -- |
Source: Public Records
Mortgage History
| Date | Status | Borrower | Loan Amount |
|---|---|---|---|
| Open | Flores Rubin Silva | $3,000 | |
| Previous Owner | Ortiz Javier | $71,907 |
Source: Public Records
Tax History Compared to Growth
Tax History
| Year | Tax Paid | Tax Assessment Tax Assessment Total Assessment is a certain percentage of the fair market value that is determined by local assessors to be the total taxable value of land and additions on the property. | Land | Improvement |
|---|---|---|---|---|
| 2025 | $1,970 | $116,400 | $21,400 | $95,000 |
| 2024 | $1,970 | $100,100 | $18,400 | $81,700 |
| 2023 | $1,990 | $100,100 | $18,400 | $81,700 |
| 2022 | $1,974 | $84,400 | $16,000 | $68,400 |
| 2021 | $1,830 | $84,400 | $16,000 | $68,400 |
| 2020 | $1,900 | $73,300 | $14,000 | $59,300 |
| 2019 | $1,718 | $73,300 | $14,000 | $59,300 |
| 2018 | $1,700 | $63,900 | $12,200 | $51,700 |
| 2017 | $1,710 | $63,900 | $12,200 | $51,700 |
| 2016 | $1,666 | $63,200 | $11,900 | $51,300 |
| 2015 | $1,666 | $63,200 | $11,900 | $51,300 |
| 2014 | $1,652 | $64,500 | $12,100 | $52,400 |
Source: Public Records
Map
Nearby Homes