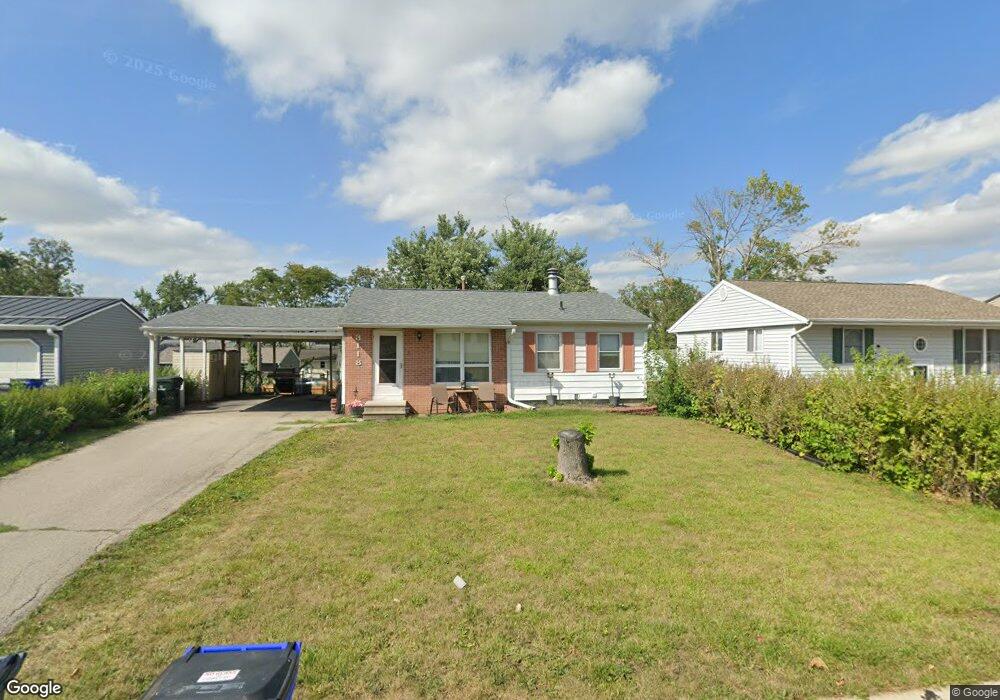
3118 Coral Ln SW Cedar Rapids, IA 52404
Estimated Value: $121,000 - $191,000
3
Beds
1
Bath
1,219
Sq Ft
$127/Sq Ft
Est. Value
About This Home
This home is located at 3118 Coral Ln SW, Cedar Rapids, IA 52404 and is currently estimated at $154,697, approximately $126 per square foot. 3118 Coral Ln SW is a home located in Linn County with nearby schools including Prairie Crest Elementary School, Prairie View Elementary School, and Prairie Ridge Elementary School.
Ownership History
Date
Name
Owned For
Owner Type
Purchase Details
Closed on
Nov 3, 2023
Sold by
Seastrom Sandy D and Seastrom Michael
Bought by
Starr Dawn M
Current Estimated Value
Home Financials for this Owner
Home Financials are based on the most recent Mortgage that was taken out on this home.
Original Mortgage
$85,172
Outstanding Balance
$83,683
Interest Rate
7.49%
Mortgage Type
FHA
Estimated Equity
$71,014
Purchase Details
Closed on
Jun 11, 2020
Sold by
Mclane Gerald D
Bought by
Seastrom Sandy D and Seastrom Michael
Purchase Details
Closed on
Aug 6, 2008
Sold by
Mclane Jerry D
Bought by
Starr Dawn M
Home Financials for this Owner
Home Financials are based on the most recent Mortgage that was taken out on this home.
Original Mortgage
$102,950
Interest Rate
6.51%
Mortgage Type
Seller Take Back
Create a Home Valuation Report for This Property
The Home Valuation Report is an in-depth analysis detailing your home's value as well as a comparison with similar homes in the area
Home Values in the Area
Average Home Value in this Area
Purchase History
| Date | Buyer | Sale Price | Title Company |
|---|---|---|---|
| Starr Dawn M | $113,000 | None Listed On Document | |
| Seastrom Sandy D | -- | None Available | |
| Starr Dawn M | $112,950 | None Available |
Source: Public Records
Mortgage History
| Date | Status | Borrower | Loan Amount |
|---|---|---|---|
| Open | Starr Dawn M | $85,172 | |
| Previous Owner | Starr Dawn M | $102,950 |
Source: Public Records
Tax History Compared to Growth
Tax History
| Year | Tax Paid | Tax Assessment Tax Assessment Total Assessment is a certain percentage of the fair market value that is determined by local assessors to be the total taxable value of land and additions on the property. | Land | Improvement |
|---|---|---|---|---|
| 2025 | $2,506 | $150,000 | $35,300 | $114,700 |
| 2024 | $2,648 | $145,300 | $32,400 | $112,900 |
| 2023 | $2,648 | $132,300 | $32,400 | $99,900 |
| 2022 | $2,542 | $119,500 | $26,800 | $92,700 |
| 2021 | $2,504 | $117,000 | $26,800 | $90,200 |
| 2020 | $2,504 | $110,000 | $24,000 | $86,000 |
| 2019 | $2,408 | $107,400 | $24,000 | $83,400 |
| 2018 | $2,342 | $107,400 | $24,000 | $83,400 |
| 2017 | $2,268 | $106,300 | $24,000 | $82,300 |
| 2016 | $2,268 | $104,800 | $24,000 | $80,800 |
| 2015 | $2,244 | $104,282 | $23,970 | $80,312 |
| 2014 | $2,244 | $104,282 | $23,970 | $80,312 |
| 2013 | $2,328 | $104,282 | $23,970 | $80,312 |
Source: Public Records
Map
Nearby Homes
- 3132 Pebble Dr SW
- 3009 Carriage Dr SW
- 3226 Bramble Rd SW
- 3205 33rd Ave SW
- 3221 Bramble Rd SW
- 3108 Huxley Ln SW
- 3405 Queen Dr SW
- 2812 29th Ave SW
- 3619 King Dr SW
- 3715 33rd Ave SW Unit 4.8 AC
- 3715 33rd Ave SW Unit 5.8 AC
- 3715 33rd Ave SW Unit 1 AC
- 2521 Radcliffe Ct SW
- 3737 Monarch Dr SW
- 3302 Sokol Ln SW
- 3406 Sokol Ln SW
- 3424 Sokol Ln SW
- 3315 Sokol Ln SW
- 3845 37th Ave SW Unit B
- 3321 Sokol Ln SW
- 3122 Coral Ln SW
- 3119 Bayberry Dr SW
- 3115 Bayberry Dr SW
- 3123 Bayberry Dr SW
- 3110 Coral Ln SW
- 3126 Coral Ln SW
- 3119 Coral Ln SW
- 3111 Bayberry Dr SW
- 3127 Bayberry Dr SW
- 3123 Coral Ln SW
- 3115 Coral Ln SW
- 3130 Coral Ln SW
- 3106 Coral Ln SW
- 3127 Coral Ln SW
- 3111 Coral Ln SW
- 3107 Bayberry Dr SW
- 3131 Bayberry Dr SW
- 3131 Coral Ln SW
- 3107 Coral Ln SW
- 3134 Coral Ln SW