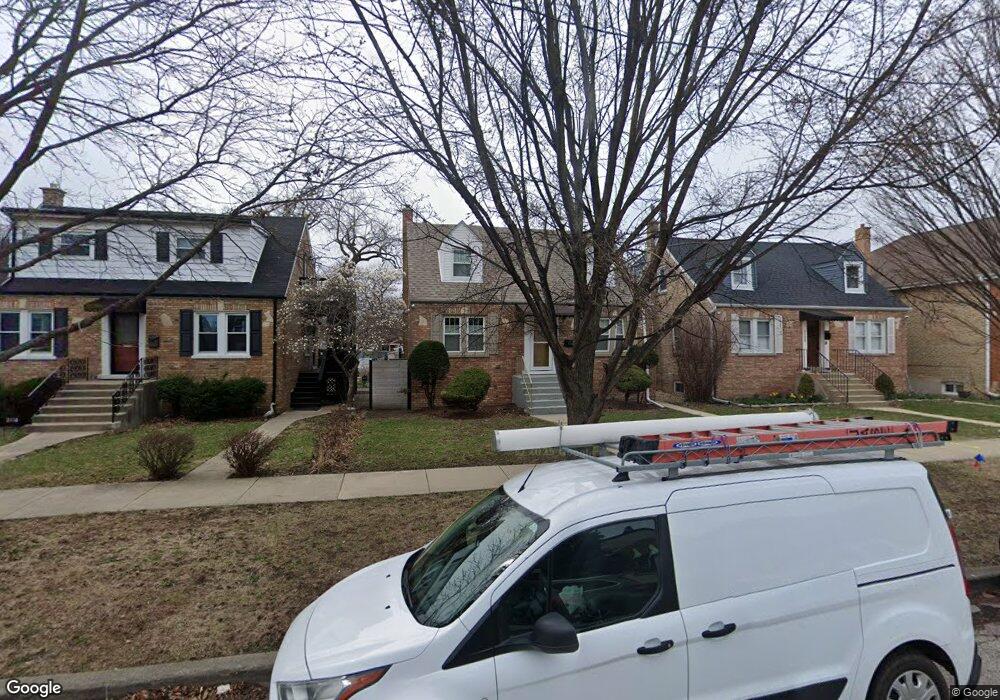
3118 Elder Ln Franklin Park, IL 60131
Estimated Value: $348,155 - $387,000
3
Beds
2
Baths
1,296
Sq Ft
$287/Sq Ft
Est. Value
About This Home
This home is located at 3118 Elder Ln, Franklin Park, IL 60131 and is currently estimated at $371,539, approximately $286 per square foot. 3118 Elder Ln is a home located in Cook County with nearby schools including Passow Elementary School, Hester Jr High School, and East Leyden High School.
Ownership History
Date
Name
Owned For
Owner Type
Purchase Details
Closed on
Mar 26, 2002
Sold by
Cornejo Alcibiades and Cornejo Alicia
Bought by
Villariny Eddie C and Acevedo Sindia I
Current Estimated Value
Home Financials for this Owner
Home Financials are based on the most recent Mortgage that was taken out on this home.
Original Mortgage
$182,400
Outstanding Balance
$75,667
Interest Rate
6.82%
Estimated Equity
$295,872
Create a Home Valuation Report for This Property
The Home Valuation Report is an in-depth analysis detailing your home's value as well as a comparison with similar homes in the area
Home Values in the Area
Average Home Value in this Area
Purchase History
| Date | Buyer | Sale Price | Title Company |
|---|---|---|---|
| Villariny Eddie C | $192,000 | -- |
Source: Public Records
Mortgage History
| Date | Status | Borrower | Loan Amount |
|---|---|---|---|
| Open | Villariny Eddie C | $182,400 |
Source: Public Records
Tax History Compared to Growth
Tax History
| Year | Tax Paid | Tax Assessment Tax Assessment Total Assessment is a certain percentage of the fair market value that is determined by local assessors to be the total taxable value of land and additions on the property. | Land | Improvement |
|---|---|---|---|---|
| 2024 | $7,581 | $24,850 | $4,464 | $20,386 |
| 2023 | $7,789 | $28,000 | $4,464 | $23,536 |
| 2022 | $7,789 | $28,000 | $4,464 | $23,536 |
| 2021 | $5,663 | $17,627 | $3,224 | $14,403 |
| 2020 | $5,474 | $17,627 | $3,224 | $14,403 |
| 2019 | $5,713 | $19,918 | $3,224 | $16,694 |
| 2018 | $6,254 | $18,934 | $2,728 | $16,206 |
| 2017 | $6,187 | $18,934 | $2,728 | $16,206 |
| 2016 | $6,762 | $20,792 | $2,728 | $18,064 |
| 2015 | $6,919 | $20,342 | $2,480 | $17,862 |
| 2014 | $6,757 | $20,342 | $2,480 | $17,862 |
| 2013 | $6,242 | $20,342 | $2,480 | $17,862 |
Source: Public Records
Map
Nearby Homes