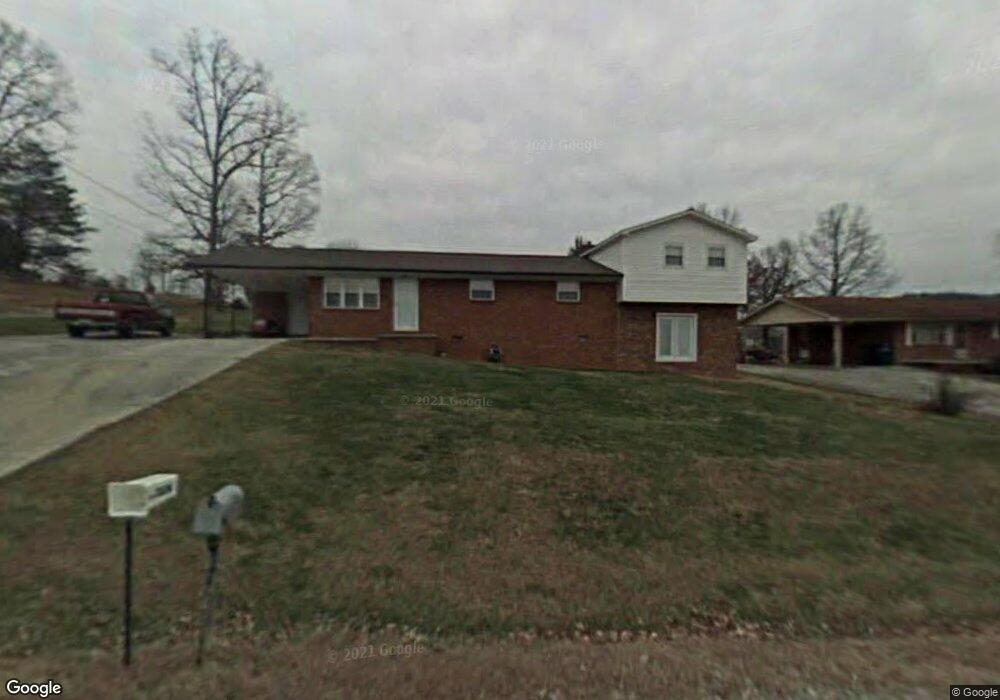
3118 Lon Cir Morristown, TN 37813
Estimated Value: $229,000 - $293,264
3
Beds
2
Baths
2,147
Sq Ft
$128/Sq Ft
Est. Value
About This Home
This home is located at 3118 Lon Cir, Morristown, TN 37813 and is currently estimated at $274,066, approximately $127 per square foot. 3118 Lon Cir is a home located in Hamblen County with nearby schools including Union Heights Elementary School, East Ridge Middle School, and Morristown East High School.
Ownership History
Date
Name
Owned For
Owner Type
Purchase Details
Closed on
Feb 12, 2021
Sold by
Wolfe Dale
Bought by
Noe Jeffrey S and Thomas Lea Ann
Current Estimated Value
Home Financials for this Owner
Home Financials are based on the most recent Mortgage that was taken out on this home.
Original Mortgage
$166,666
Outstanding Balance
$148,806
Interest Rate
2.6%
Mortgage Type
New Conventional
Estimated Equity
$125,260
Purchase Details
Closed on
Jul 6, 2020
Sold by
Wilson Doris Ann and Wilson Billy Kyle
Bought by
Wolfe Dale
Purchase Details
Closed on
Mar 30, 2018
Sold by
Wilson James Edward and Wilson Johnny Carl
Bought by
Wilson Billy Kyle and Wilson Doris Ann
Purchase Details
Closed on
Mar 30, 2006
Bought by
Wilson Billy Kyle and Wilson Doris Ann
Purchase Details
Closed on
Apr 14, 1967
Bought by
Wilson Billy Kyle and Doris Ann
Create a Home Valuation Report for This Property
The Home Valuation Report is an in-depth analysis detailing your home's value as well as a comparison with similar homes in the area
Home Values in the Area
Average Home Value in this Area
Purchase History
| Date | Buyer | Sale Price | Title Company |
|---|---|---|---|
| Noe Jeffrey S | $165,000 | None Available | |
| Noe Jeffrey S | $165,000 | None Listed On Document | |
| Wolfe Dale | $95,000 | None Available | |
| Wilson Billy Kyle | -- | None Available | |
| Wilson Billy Kyle | -- | -- | |
| Wilson Billy Kyle | -- | -- |
Source: Public Records
Mortgage History
| Date | Status | Borrower | Loan Amount |
|---|---|---|---|
| Open | Noe Jeffrey S | $166,666 | |
| Closed | Noe Jeffrey S | $166,666 |
Source: Public Records
Tax History Compared to Growth
Tax History
| Year | Tax Paid | Tax Assessment Tax Assessment Total Assessment is a certain percentage of the fair market value that is determined by local assessors to be the total taxable value of land and additions on the property. | Land | Improvement |
|---|---|---|---|---|
| 2024 | $673 | $34,150 | $4,300 | $29,850 |
| 2023 | $673 | $34,150 | $0 | $0 |
| 2022 | $673 | $34,150 | $4,300 | $29,850 |
| 2021 | $668 | $34,150 | $4,300 | $29,850 |
| 2020 | $600 | $33,925 | $4,300 | $29,625 |
| 2019 | $600 | $30,675 | $3,950 | $26,725 |
| 2018 | $600 | $30,675 | $3,950 | $26,725 |
| 2017 | $600 | $30,675 | $3,950 | $26,725 |
| 2016 | $600 | $30,675 | $3,950 | $26,725 |
| 2015 | $567 | $30,675 | $3,950 | $26,725 |
| 2014 | -- | $30,675 | $3,950 | $26,725 |
| 2013 | -- | $32,450 | $0 | $0 |
Source: Public Records
Map
Nearby Homes
- 2137 Highview Dr
- 2205 Kingswood Dr
- 2840-2830 Robinson Creek Rd
- 1744 Carroll Rd
- 1496 Dover Rd
- 1689 Carroll Rd
- 0 Thompson Creek Rd
- 1575 Thompson Creek Rd
- 0 Springvale Rd
- 3080 Chucky River Rd
- 1148 George Byrd Rd
- 4271 Stansberry Rd
- 3661 Halifax Cir
- 2945 Enka Hwy
- 4270 Brockland Dr
- 1342 Slop Creek Rd
- 4581 Lockley Ct
- 1256 Arden Ln