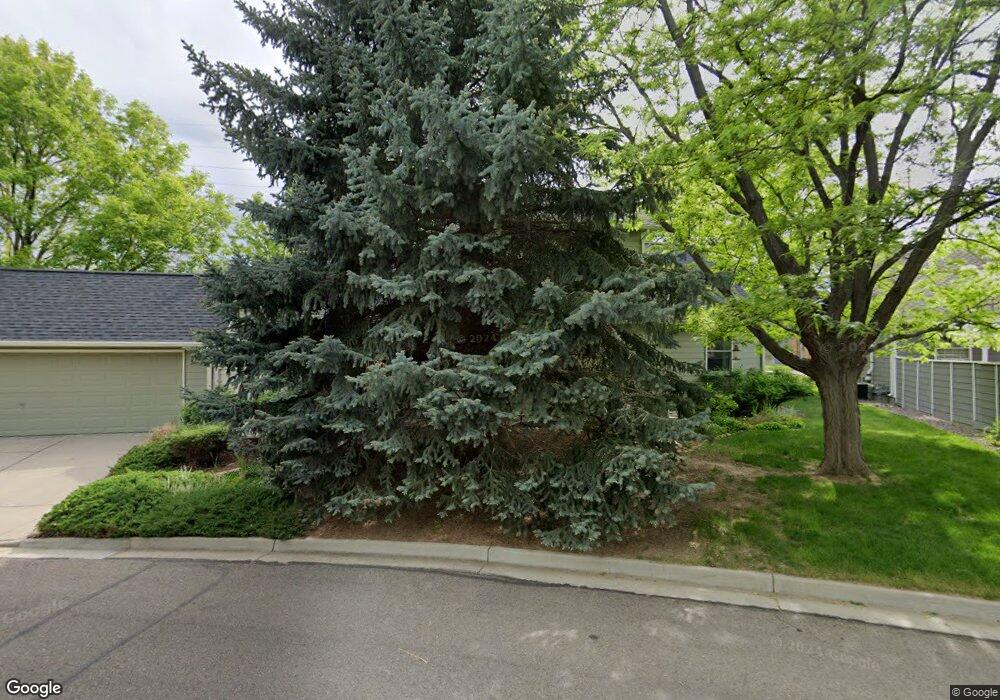
3119 Concord Way Longmont, CO 80503
McIntosh NeighborhoodEstimated Value: $549,000 - $583,000
4
Beds
3
Baths
1,728
Sq Ft
$324/Sq Ft
Est. Value
About This Home
This home is located at 3119 Concord Way, Longmont, CO 80503 and is currently estimated at $559,913, approximately $324 per square foot. 3119 Concord Way is a home located in Boulder County with nearby schools including Hygiene Elementary School, Westview Middle School, and Longmont High School.
Ownership History
Date
Name
Owned For
Owner Type
Purchase Details
Closed on
Aug 27, 2012
Sold by
Danzl James J
Bought by
Fowler Mark L
Current Estimated Value
Home Financials for this Owner
Home Financials are based on the most recent Mortgage that was taken out on this home.
Original Mortgage
$238,789
Outstanding Balance
$166,628
Interest Rate
3.75%
Mortgage Type
FHA
Estimated Equity
$393,285
Purchase Details
Closed on
Oct 21, 1999
Sold by
Danzl James J and Danzl Kathy J
Bought by
Danzl James J
Purchase Details
Closed on
Apr 7, 1995
Sold by
Jones Paul E
Bought by
Danzl James J
Home Financials for this Owner
Home Financials are based on the most recent Mortgage that was taken out on this home.
Original Mortgage
$99,500
Interest Rate
8.53%
Purchase Details
Closed on
Mar 1, 1993
Bought by
Fowler Mark L and Fowler Cathy A
Purchase Details
Closed on
Feb 4, 1993
Bought by
Fowler Mark L and Fowler Cathy A
Create a Home Valuation Report for This Property
The Home Valuation Report is an in-depth analysis detailing your home's value as well as a comparison with similar homes in the area
Home Values in the Area
Average Home Value in this Area
Purchase History
| Date | Buyer | Sale Price | Title Company |
|---|---|---|---|
| Fowler Mark L | $245,000 | None Available | |
| Danzl James J | -- | -- | |
| Danzl James J | $163,900 | Stewart Title | |
| Fowler Mark L | $132,900 | -- | |
| Fowler Mark L | -- | -- |
Source: Public Records
Mortgage History
| Date | Status | Borrower | Loan Amount |
|---|---|---|---|
| Open | Fowler Mark L | $238,789 | |
| Previous Owner | Danzl James J | $99,500 |
Source: Public Records
Tax History Compared to Growth
Tax History
| Year | Tax Paid | Tax Assessment Tax Assessment Total Assessment is a certain percentage of the fair market value that is determined by local assessors to be the total taxable value of land and additions on the property. | Land | Improvement |
|---|---|---|---|---|
| 2025 | $3,001 | $37,513 | $6,619 | $30,894 |
| 2024 | $3,001 | $37,513 | $6,619 | $30,894 |
| 2023 | $2,960 | $38,076 | $7,357 | $34,405 |
| 2022 | $3,195 | $32,282 | $5,636 | $26,646 |
| 2021 | $3,236 | $33,212 | $5,799 | $27,413 |
| 2020 | $2,918 | $30,044 | $5,291 | $24,753 |
| 2019 | $2,872 | $30,044 | $5,291 | $24,753 |
| 2018 | $2,273 | $23,933 | $5,328 | $18,605 |
| 2017 | $2,242 | $26,459 | $5,890 | $20,569 |
| 2016 | $2,168 | $22,686 | $8,915 | $13,771 |
| 2015 | $2,066 | $20,394 | $4,776 | $15,618 |
| 2014 | $1,905 | $20,394 | $4,776 | $15,618 |
Source: Public Records
Map
Nearby Homes
- 3125 Concord Way
- 3132 Concord Way
- 3119 Lake Park Way
- 2292 Spinnaker Cir
- 12682 Anhawa Ave
- 13205 N 87th St
- 2425 Willow Ln
- 2634 Westlake Ct
- 2421 Maplewood Cir W
- 1746 Cove Ct
- 2158 Rockspray Ct
- 12788 Sheramdi St
- 2078 Goldfinch Ct
- 3308 Lakeview Cir
- 2138 Cypress St
- 2424 Maplewood Cir E
- 2330 Wedgewood Ave
- 8523 Hygiene Rd
- 2508 Danbury Dr
- 2521 Danbury Dr
- 3121 Concord Way
- 3117 Concord Way
- 3120 Concord Way
- 3118 Concord Way
- 3123 Concord Way
- 3127 Concord Way
- 3113 Concord Way
- 3122 Concord Way
- 3111 Concord Way
- 3110 Concord Way
- 3124 Concord Way
- 3126 Concord Way
- 3133 Concord Way
- 3113 Almeria Way
- 3129 Concord Way
- 3109 Concord Way
- 3108 Concord Way
- 3131 Concord Way
- 3111 Almeria Way
- 3115 Almeria Way