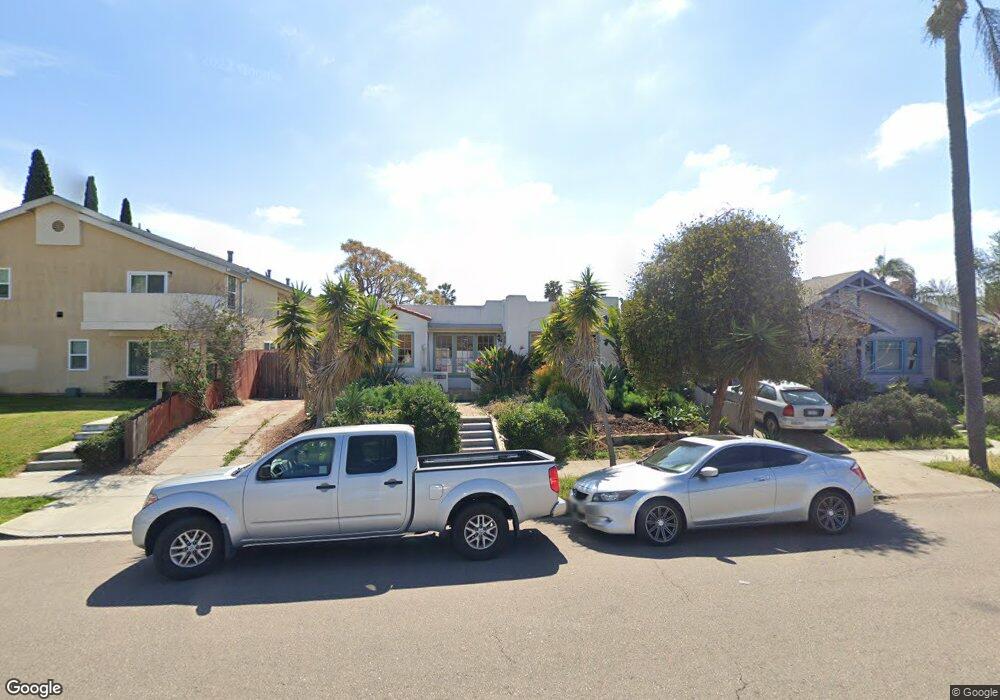
3119 Ivy St San Diego, CA 92104
South Park NeighborhoodEstimated Value: $1,144,000 - $1,192,000
2
Beds
2
Baths
1,330
Sq Ft
$879/Sq Ft
Est. Value
About This Home
This home is located at 3119 Ivy St, San Diego, CA 92104 and is currently estimated at $1,168,591, approximately $878 per square foot. 3119 Ivy St is a home located in San Diego County with nearby schools including Golden Hill Elementary School, Roosevelt International Middle School, and Mcgill School Of Success.
Ownership History
Date
Name
Owned For
Owner Type
Purchase Details
Closed on
Jan 11, 2012
Sold by
Kelley Maria Teresa
Bought by
Kelley Maria Teresa and Barroso Peter
Current Estimated Value
Purchase Details
Closed on
Oct 21, 2010
Sold by
Barroso Peter M
Bought by
Kelley Maria Teresa
Purchase Details
Closed on
Jul 23, 1999
Sold by
Qinying Ferkovich and Qinying Lin
Bought by
Barroso Peter M and Kelley Maria Teresa
Home Financials for this Owner
Home Financials are based on the most recent Mortgage that was taken out on this home.
Original Mortgage
$119,000
Outstanding Balance
$33,702
Interest Rate
7.7%
Estimated Equity
$1,134,889
Purchase Details
Closed on
Dec 22, 1997
Sold by
Jenkins Peggy F and Carreon Phillip P
Bought by
Perkovich Scott and Lin Qinying
Home Financials for this Owner
Home Financials are based on the most recent Mortgage that was taken out on this home.
Original Mortgage
$108,000
Interest Rate
6.9%
Purchase Details
Closed on
May 9, 1995
Sold by
Jenkins Peggy F
Bought by
Jenkins Peggy F and Carreon Phillip Paul
Create a Home Valuation Report for This Property
The Home Valuation Report is an in-depth analysis detailing your home's value as well as a comparison with similar homes in the area
Home Values in the Area
Average Home Value in this Area
Purchase History
| Date | Buyer | Sale Price | Title Company |
|---|---|---|---|
| Kelley Maria Teresa | -- | None Available | |
| Kelley Maria Teresa | -- | Lawyers Title Sd | |
| Barroso Peter M | $174,000 | First American Title | |
| Perkovich Scott | $135,000 | Chicago Title Co | |
| Jenkins Peggy F | -- | -- |
Source: Public Records
Mortgage History
| Date | Status | Borrower | Loan Amount |
|---|---|---|---|
| Open | Barroso Peter M | $119,000 | |
| Previous Owner | Perkovich Scott | $108,000 |
Source: Public Records
Tax History Compared to Growth
Tax History
| Year | Tax Paid | Tax Assessment Tax Assessment Total Assessment is a certain percentage of the fair market value that is determined by local assessors to be the total taxable value of land and additions on the property. | Land | Improvement |
|---|---|---|---|---|
| 2025 | $3,169 | $267,409 | $153,688 | $113,721 |
| 2024 | $3,169 | $262,167 | $150,675 | $111,492 |
| 2023 | $3,097 | $257,027 | $147,721 | $109,306 |
| 2022 | $3,013 | $251,988 | $144,825 | $107,163 |
| 2021 | $2,991 | $247,048 | $141,986 | $105,062 |
| 2020 | $2,954 | $244,516 | $140,531 | $103,985 |
| 2019 | $2,900 | $239,723 | $137,776 | $101,947 |
| 2018 | $2,711 | $235,024 | $135,075 | $99,949 |
| 2017 | $80 | $230,417 | $132,427 | $97,990 |
| 2016 | $2,600 | $225,900 | $129,831 | $96,069 |
| 2015 | $2,561 | $222,507 | $127,881 | $94,626 |
| 2014 | $2,520 | $218,149 | $125,376 | $92,773 |
Source: Public Records
Map
Nearby Homes
- 3045-49 Juniper St
- 2144 30th St
- 2126-34 30th St
- 2433 San Marcos Ave
- 1930 30th St
- 1820 Bancroft St
- 1728 Bancroft St
- 2950 Nutmeg St
- 3005 Olive St
- 2748 30th St
- 1603 Felton St
- 1603-5 Felton St
- 3440 Fir St
- 3129 Redwood St
- 2404 Montclair St
- 2324 Montclair St
- 3132 31st St
- 3274 Redwood St
- 3124-26 32nd St
- 2931 Thorn St
- 3109 Ivy St
- 2133 31st St
- 2133-35 31st St
- 2133-35 31st St
- 2129 31st St
- 3135 Ivy St
- 3103 Ivy St
- 3145 Ivy St Unit 47
- 2119 31st St
- 3120 Hawthorn St Unit 22
- 3112 Hawthorn St
- 3128 Hawthorn St
- 3136 Hawthorn St
- 3151 Ivy St Unit 53
- 3146 Hawthorn St
- 3112 Ivy St
- 3106 Ivy St
- 3083 Ivy St
- 3136 Ivy St Unit 38
- 3102 Hawthorn St