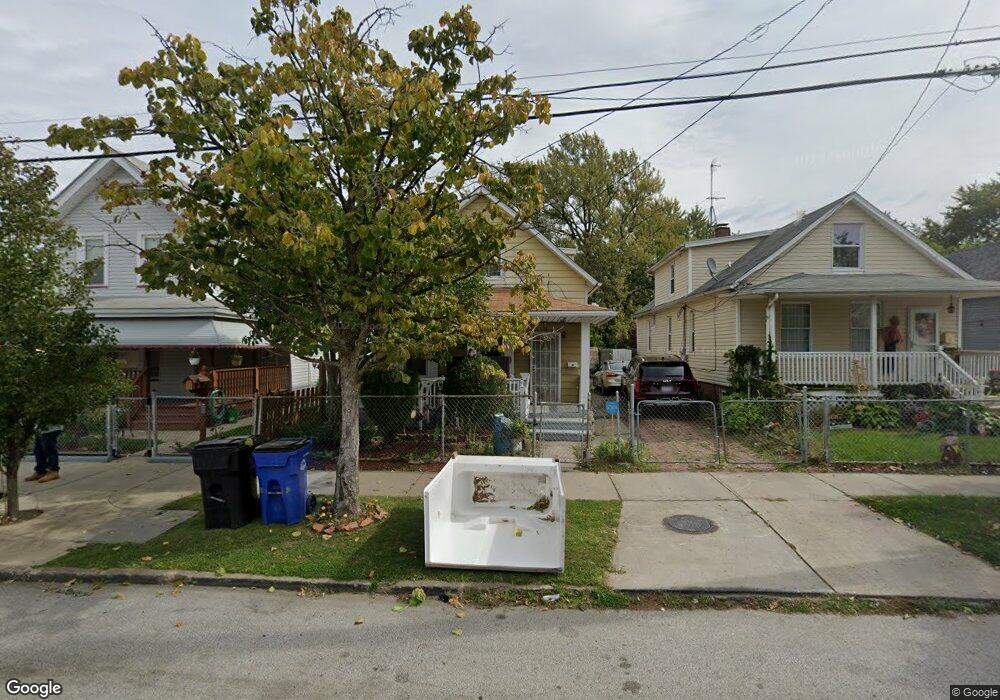
3119 W 44th St Cleveland, OH 44109
Clark-Fulton NeighborhoodEstimated Value: $94,580 - $134,000
3
Beds
1
Bath
1,388
Sq Ft
$83/Sq Ft
Est. Value
About This Home
This home is located at 3119 W 44th St, Cleveland, OH 44109 and is currently estimated at $115,145, approximately $82 per square foot. 3119 W 44th St is a home located in Cuyahoga County with nearby schools including Almira Academy, Anton Grdina School, and Benjamin Franklin.
Ownership History
Date
Name
Owned For
Owner Type
Purchase Details
Closed on
Oct 31, 2000
Sold by
Rodriguez Jose L and Rodriguez Elsa M
Bought by
Rodriguez Jose L
Current Estimated Value
Home Financials for this Owner
Home Financials are based on the most recent Mortgage that was taken out on this home.
Original Mortgage
$35,489
Interest Rate
7.61%
Purchase Details
Closed on
Feb 8, 1993
Sold by
Palmero Alejandro
Bought by
Rodriguez Jose L
Purchase Details
Closed on
Nov 17, 1992
Sold by
Rivera Soraida
Bought by
Palmero Alejandro
Purchase Details
Closed on
Feb 21, 1991
Sold by
Palmero Alejandro
Bought by
Rivera Soraida
Purchase Details
Closed on
Sep 5, 1989
Sold by
Vielmann Salvador
Bought by
Palmero Alejandro
Purchase Details
Closed on
Jan 4, 1988
Sold by
Reyes Julio
Bought by
Reyes Migdalia
Purchase Details
Closed on
Jan 1, 1975
Bought by
Reyes Julio
Create a Home Valuation Report for This Property
The Home Valuation Report is an in-depth analysis detailing your home's value as well as a comparison with similar homes in the area
Home Values in the Area
Average Home Value in this Area
Purchase History
| Date | Buyer | Sale Price | Title Company |
|---|---|---|---|
| Rodriguez Jose L | -- | Real Estate Title | |
| Rodriguez Jose L | $24,500 | -- | |
| Palmero Alejandro | -- | -- | |
| Rivera Soraida | $6,000 | -- | |
| Palmero Alejandro | $8,500 | -- | |
| Vielmann Salvador | -- | -- | |
| Vielmann Salvador | $10,000 | -- | |
| Reyes Migdalia | -- | -- | |
| Reyes Julio | -- | -- |
Source: Public Records
Mortgage History
| Date | Status | Borrower | Loan Amount |
|---|---|---|---|
| Previous Owner | Rodriguez Jose L | $35,489 | |
| Closed | Rodriguez Jose L | $5,000 |
Source: Public Records
Tax History Compared to Growth
Tax History
| Year | Tax Paid | Tax Assessment Tax Assessment Total Assessment is a certain percentage of the fair market value that is determined by local assessors to be the total taxable value of land and additions on the property. | Land | Improvement |
|---|---|---|---|---|
| 2024 | $1,145 | $27,265 | $5,075 | $22,190 |
| 2023 | $226 | $12,150 | $3,220 | $8,930 |
| 2022 | $256 | $12,150 | $3,220 | $8,930 |
| 2021 | $254 | $12,150 | $3,220 | $8,930 |
| 2020 | $52 | $9,350 | $2,490 | $6,860 |
| 2019 | $48 | $26,700 | $7,100 | $19,600 |
| 2018 | $133 | $9,350 | $2,490 | $6,860 |
| 2017 | $219 | $11,410 | $3,360 | $8,050 |
| 2016 | $218 | $11,410 | $3,360 | $8,050 |
| 2015 | $323 | $11,410 | $3,360 | $8,050 |
| 2014 | $323 | $12,680 | $3,750 | $8,930 |
Source: Public Records
Map
Nearby Homes
- 4141 Cyril Ave
- 4137 Cyril Ave
- 3196 W 43rd St
- 3207 W 44th St
- 3205 W 46th St
- 3184 W 46th St
- 4131 Newark Ave
- 4144 Hyde Ave
- 4429 Hyde Ave
- 3252 W 41st St
- 5003 Clark Ave
- 3225 W 50th St
- 3188 W 38th St
- 3295 W 44th St
- 4403 Fenwick Ave
- 3185 W 38th St
- 3615 Trent Ave
- 3319 W 44th St
- 3273 W 50th St
- 3279 W 50th St