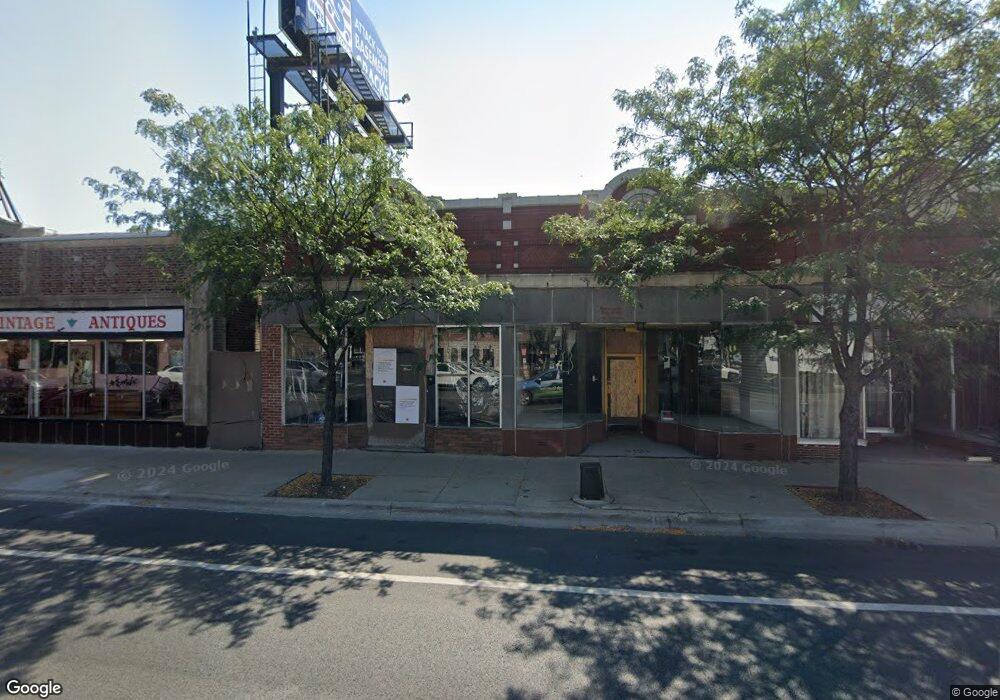
3119 W Irving Park Rd Chicago, IL 60618
Irving Park NeighborhoodEstimated Value: $749,382
--
Bed
--
Bath
11,200
Sq Ft
$67/Sq Ft
Est. Value
About This Home
This home is located at 3119 W Irving Park Rd, Chicago, IL 60618 and is currently estimated at $749,382, approximately $66 per square foot. 3119 W Irving Park Rd is a home located in Cook County with nearby schools including Cleveland Elementary School, Schurz High School, and CICS Irving Park.
Ownership History
Date
Name
Owned For
Owner Type
Purchase Details
Closed on
May 1, 2025
Sold by
Roothaus Llc
Bought by
Asrin Mehdi Llc
Current Estimated Value
Home Financials for this Owner
Home Financials are based on the most recent Mortgage that was taken out on this home.
Original Mortgage
$514,500
Outstanding Balance
$347,256
Interest Rate
7.5%
Mortgage Type
Construction
Estimated Equity
$402,126
Purchase Details
Closed on
Oct 6, 2023
Sold by
Haralampopoulos & Haralampopoulos Llc
Bought by
Roothaus Llc
Home Financials for this Owner
Home Financials are based on the most recent Mortgage that was taken out on this home.
Original Mortgage
$612,850
Interest Rate
7.18%
Mortgage Type
New Conventional
Purchase Details
Closed on
Jul 27, 2011
Sold by
Revoca Halamaou Argyrios Haralampopoulos
Bought by
Haralampopoulos & Haralampopoulos Llc
Create a Home Valuation Report for This Property
The Home Valuation Report is an in-depth analysis detailing your home's value as well as a comparison with similar homes in the area
Home Values in the Area
Average Home Value in this Area
Purchase History
| Date | Buyer | Sale Price | Title Company |
|---|---|---|---|
| Asrin Mehdi Llc | $735,000 | Proper Title | |
| Roothaus Llc | $721,000 | Greater Illinois Title | |
| Haralampopoulos & Haralampopoulos Llc | -- | None Available |
Source: Public Records
Mortgage History
| Date | Status | Borrower | Loan Amount |
|---|---|---|---|
| Open | Asrin Mehdi Llc | $514,500 | |
| Previous Owner | Roothaus Llc | $612,850 |
Source: Public Records
Tax History Compared to Growth
Tax History
| Year | Tax Paid | Tax Assessment Tax Assessment Total Assessment is a certain percentage of the fair market value that is determined by local assessors to be the total taxable value of land and additions on the property. | Land | Improvement |
|---|---|---|---|---|
| 2024 | $28,591 | $131,500 | $93,100 | $38,400 |
| 2023 | $27,852 | $128,456 | $47,880 | $80,576 |
| 2022 | $27,852 | $128,456 | $47,880 | $80,576 |
| 2021 | $15,453 | $72,997 | $47,880 | $25,117 |
| 2020 | $16,252 | $69,230 | $47,880 | $21,350 |
| 2019 | $14,646 | $69,124 | $47,880 | $21,244 |
| 2018 | $12,906 | $61,956 | $47,880 | $14,076 |
| 2017 | $12,334 | $54,292 | $41,895 | $12,397 |
| 2016 | $12,166 | $57,407 | $41,895 | $15,512 |
| 2015 | $11,148 | $57,407 | $41,895 | $15,512 |
| 2014 | $14,819 | $74,947 | $41,895 | $33,052 |
| 2013 | $14,529 | $74,947 | $41,895 | $33,052 |
Source: Public Records
Map
Nearby Homes
- 4027 N Troy St
- 4015 N Albany Ave
- 3042 W Irving Park Rd
- 3911 N Kedzie Ave
- 3024 W Irving Park Rd Unit 1S
- 3934 N Sawyer Ave
- 3223 W Belle Plaine Ave
- 4116 N Kedzie Ave
- 3815 N Kedzie Ave Unit 3S
- 3853 N Spaulding Ave
- 3801 N Kedzie Ave Unit 1S
- 3847 N Spaulding Ave
- 4141 N Kedzie Ave Unit 307
- 3748 N Troy St
- 3836 N Richmond St Unit 1N
- 3102 W Berteau Ave Unit 31023
- 3940 N Christiana Ave
- 3222 W Berteau Ave Unit 2
- 3247 W Berteau Ave
- 4123 N Richmond St
- 3123-25 W Irving Park Rd
- 3119 W Irving Park Rd
- 3113 W Irving Park Rd
- 99999999 W Irving Park Rd
- 3941 N Troy St
- 3109 W Irving Park Rd
- 3939 N Troy St
- 3101 W Irving Park Rd Unit C-E
- 3101 W Irving Park Rd Unit C
- 3937 N Troy St Unit 1
- 3114 W Irving Park Rd Unit 4W
- 3114 W Irving Park Rd Unit 4E
- 3114 W Irving Park Rd Unit 3W
- 3114 W Irving Park Rd Unit 2E
- 3114 W Irving Park Rd Unit 2W
- 3114 W Irving Park Rd Unit 3E
- 3114 W Irving Park Rd Unit 1E
- 3114 W Irving Park Rd Unit 1W
- 3114 W Irving Park Rd Unit IW
- 3938 N Albany Ave