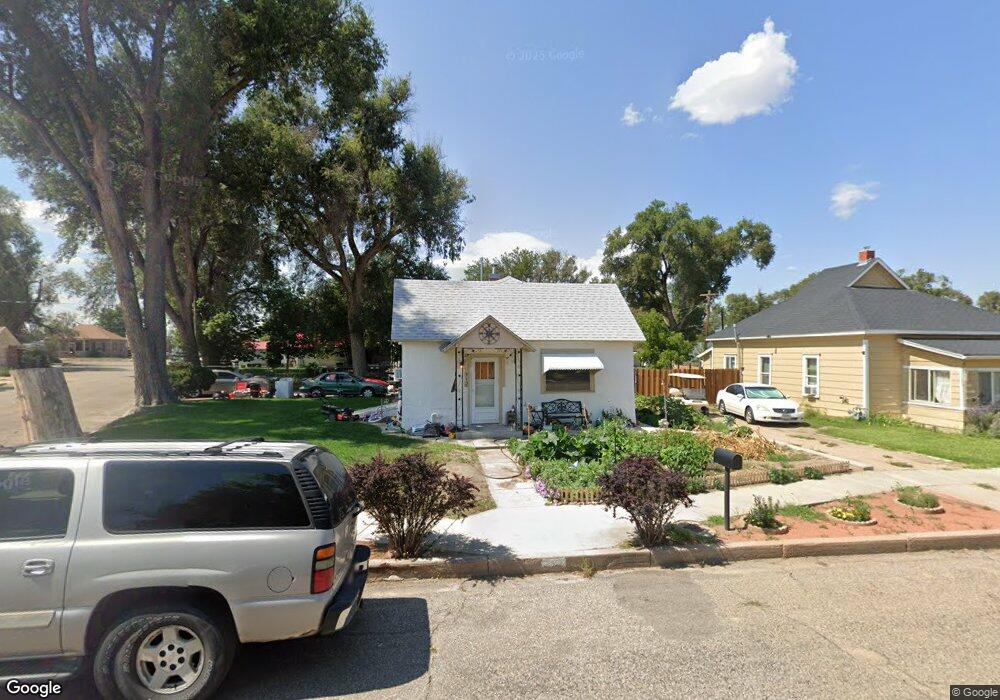
312 8th St Fowler, CO 81039
Estimated Value: $85,000 - $127,000
2
Beds
1
Bath
828
Sq Ft
$126/Sq Ft
Est. Value
About This Home
This home is located at 312 8th St, Fowler, CO 81039 and is currently estimated at $104,217, approximately $125 per square foot. 312 8th St is a home with nearby schools including Fowler Elementary School, Fowler Junior High School, and Fowler High School.
Ownership History
Date
Name
Owned For
Owner Type
Purchase Details
Closed on
May 28, 2021
Sold by
Butler Clyde Leroy
Bought by
Baker Jeffery C and Vessa Anna C
Current Estimated Value
Home Financials for this Owner
Home Financials are based on the most recent Mortgage that was taken out on this home.
Original Mortgage
$63,650
Outstanding Balance
$56,996
Interest Rate
2.9%
Mortgage Type
New Conventional
Estimated Equity
$47,221
Purchase Details
Closed on
May 27, 2021
Sold by
Butler Clyde F
Bought by
Butler Clyde Leroy
Home Financials for this Owner
Home Financials are based on the most recent Mortgage that was taken out on this home.
Original Mortgage
$63,650
Outstanding Balance
$56,996
Interest Rate
2.9%
Mortgage Type
New Conventional
Estimated Equity
$47,221
Purchase Details
Closed on
Aug 8, 2020
Sold by
Belden Paula J
Bought by
Butler Clyde Leroy
Purchase Details
Closed on
May 9, 2008
Sold by
Butler Clyde F
Bought by
Butler Leroy and Belden Paula J
Create a Home Valuation Report for This Property
The Home Valuation Report is an in-depth analysis detailing your home's value as well as a comparison with similar homes in the area
Purchase History
| Date | Buyer | Sale Price | Title Company |
|---|---|---|---|
| Baker Jeffery C | $67,000 | None Available | |
| Butler Clyde Leroy | -- | None Available | |
| Butler Clyde Leroy | -- | None Available | |
| Butler Clyde Leroy | -- | None Available | |
| Butler Leroy | -- | None Available |
Source: Public Records
Mortgage History
| Date | Status | Borrower | Loan Amount |
|---|---|---|---|
| Open | Baker Jeffery C | $63,650 |
Source: Public Records
Tax History
| Year | Tax Paid | Tax Assessment Tax Assessment Total Assessment is a certain percentage of the fair market value that is determined by local assessors to be the total taxable value of land and additions on the property. | Land | Improvement |
|---|---|---|---|---|
| 2025 | $305 | $3,630 | $0 | $0 |
| 2024 | $111 | $1,332 | $332 | $1,000 |
| 2023 | $111 | $1,332 | $332 | $1,000 |
| 2022 | $136 | $1,626 | $344 | $1,282 |
| 2021 | $139 | $1,673 | $354 | $1,319 |
| 2020 | $141 | $2,025 | $354 | $1,671 |
| 2019 | $142 | $2,025 | $354 | $1,671 |
| 2018 | $122 | $1,594 | $356 | $1,238 |
| 2017 | $122 | $1,594 | $356 | $1,238 |
| 2016 | $125 | $1,642 | $394 | $1,248 |
| 2015 | $141 | $1,642 | $394 | $1,248 |
| 2014 | $141 | $1,695 | $394 | $1,301 |
Source: Public Records
Map
Nearby Homes
Your Personal Tour Guide
Ask me questions while you tour the home.