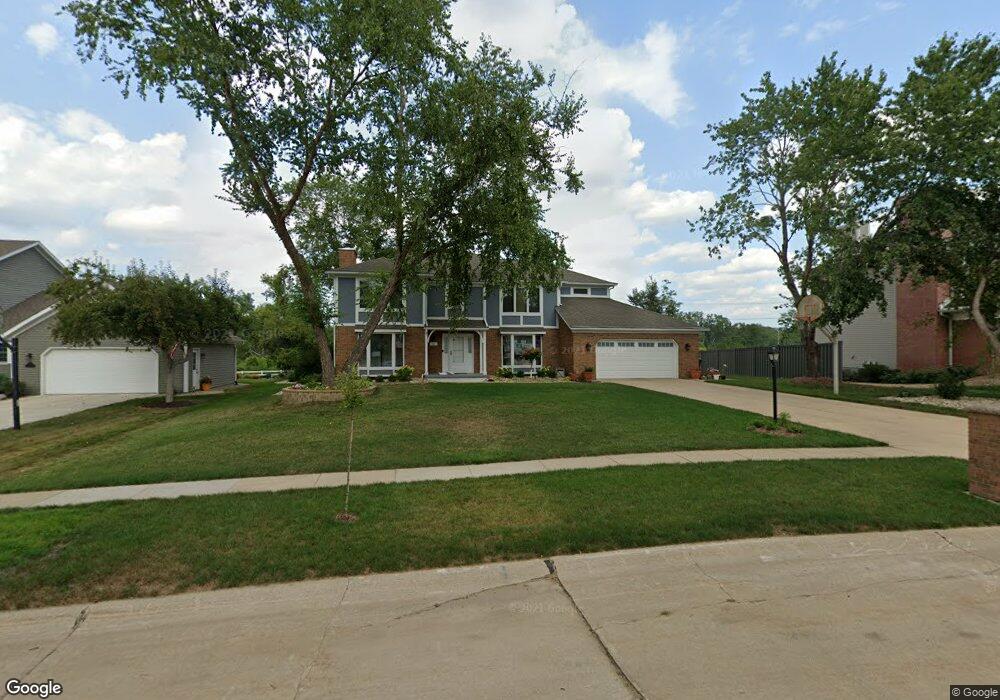
312 Ashland Ct SE Cedar Rapids, IA 52403
Estimated Value: $460,000 - $584,000
4
Beds
4
Baths
4,479
Sq Ft
$117/Sq Ft
Est. Value
About This Home
This home is located at 312 Ashland Ct SE, Cedar Rapids, IA 52403 and is currently estimated at $521,997, approximately $116 per square foot. 312 Ashland Ct SE is a home located in Linn County with nearby schools including Erskine Elementary School, McKinley STEAM Academy, and George Washington High School.
Ownership History
Date
Name
Owned For
Owner Type
Purchase Details
Closed on
Aug 18, 2011
Sold by
Hard Douglas L and Hard Rebeca
Bought by
Privett Brian K and Privett Julia D
Current Estimated Value
Home Financials for this Owner
Home Financials are based on the most recent Mortgage that was taken out on this home.
Original Mortgage
$274,400
Interest Rate
4.02%
Mortgage Type
New Conventional
Purchase Details
Closed on
Nov 22, 2010
Sold by
Sewell John H and Sewell Beth A
Bought by
Hard Douglas L and Hard Rebeca
Home Financials for this Owner
Home Financials are based on the most recent Mortgage that was taken out on this home.
Original Mortgage
$296,000
Interest Rate
4.19%
Mortgage Type
New Conventional
Purchase Details
Closed on
Jun 17, 2002
Sold by
Bogguss Joann A and Scott Bogguss J
Bought by
Sewell John H and Sewell Beth A
Home Financials for this Owner
Home Financials are based on the most recent Mortgage that was taken out on this home.
Original Mortgage
$300,000
Interest Rate
6.87%
Create a Home Valuation Report for This Property
The Home Valuation Report is an in-depth analysis detailing your home's value as well as a comparison with similar homes in the area
Home Values in the Area
Average Home Value in this Area
Purchase History
| Date | Buyer | Sale Price | Title Company |
|---|---|---|---|
| Privett Brian K | $342,500 | None Available | |
| Hard Douglas L | $369,500 | None Available | |
| Sewell John H | $384,500 | -- |
Source: Public Records
Mortgage History
| Date | Status | Borrower | Loan Amount |
|---|---|---|---|
| Previous Owner | Privett Brian K | $274,400 | |
| Previous Owner | Hard Douglas L | $296,000 | |
| Previous Owner | Sewell John H | $300,000 |
Source: Public Records
Tax History Compared to Growth
Tax History
| Year | Tax Paid | Tax Assessment Tax Assessment Total Assessment is a certain percentage of the fair market value that is determined by local assessors to be the total taxable value of land and additions on the property. | Land | Improvement |
|---|---|---|---|---|
| 2025 | $8,080 | $478,600 | $64,200 | $414,400 |
| 2024 | $8,920 | $467,000 | $64,200 | $402,800 |
| 2023 | $8,920 | $467,000 | $64,200 | $402,800 |
| 2022 | $8,760 | $431,800 | $64,200 | $367,600 |
| 2021 | $9,298 | $431,800 | $64,200 | $367,600 |
| 2020 | $9,298 | $430,000 | $64,200 | $365,800 |
| 2019 | $8,548 | $405,100 | $64,200 | $340,900 |
| 2018 | $8,308 | $405,100 | $64,200 | $340,900 |
| 2017 | $8,528 | $401,200 | $64,200 | $337,000 |
| 2016 | $8,528 | $401,200 | $64,200 | $337,000 |
| 2015 | $8,606 | $404,475 | $64,200 | $340,275 |
| 2014 | $8,606 | $404,475 | $64,200 | $340,275 |
| 2013 | $8,422 | $404,475 | $64,200 | $340,275 |
Source: Public Records
Map
Nearby Homes
- 4725 Green Valley Dr SE
- 5029 Broadlawn Dr SE
- 380 Indiandale Rd SE
- 3830 Skylark Ln SE
- 2227 Kestrel Dr SE
- 2403 Kestrel Dr SE
- 2416 Kestrel Dr SE
- 2226 Kestrel Dr SE
- 3112 Peregrine Ct SE
- 2306 Kestrel Dr SE
- 2420 Kestrel Dr SE
- 2409 Kestrel Dr SE
- 2421 Kestrel Dr SE
- 2221 Kestrel Dr SE
- 2319 Kestrel Dr SE
- 2415 Kestrel Dr SE
- 2325 Kestrel Dr SE
- 2312 Kestrel Dr SE
- 3100 Peregrine Ct SE
- 2215 Kestrel Dr SE
- 308 Ashland Ct SE
- 316 Ashland Ct SE
- 304 Ashland Ct SE
- 315 Ashland Ct SE
- 311 Ashland Ct SE
- 307 Ashland Ct SE
- 302 Ashland Ct SE
- 305 Ashland Ct SE
- 303 Ashland Ct SE
- 397 Eastland Dr SE
- 454 Parkland Dr SE
- 370 Eastland Dr SE
- 223 E Post Rd SE
- 208 E Post Rd SE
- 310 E Post Rd SE
- 316 Andover Ln SE
- 391 Eastland Dr SE
- 211 E Post Rd SE
- 448 Parkland Dr SE
- 457 Parkland Dr SE