312 Chalford Ct Franklin, TN 37069
Estimated Value: $1,317,694 - $1,485,000
5
Beds
6
Baths
5,559
Sq Ft
$256/Sq Ft
Est. Value
About This Home
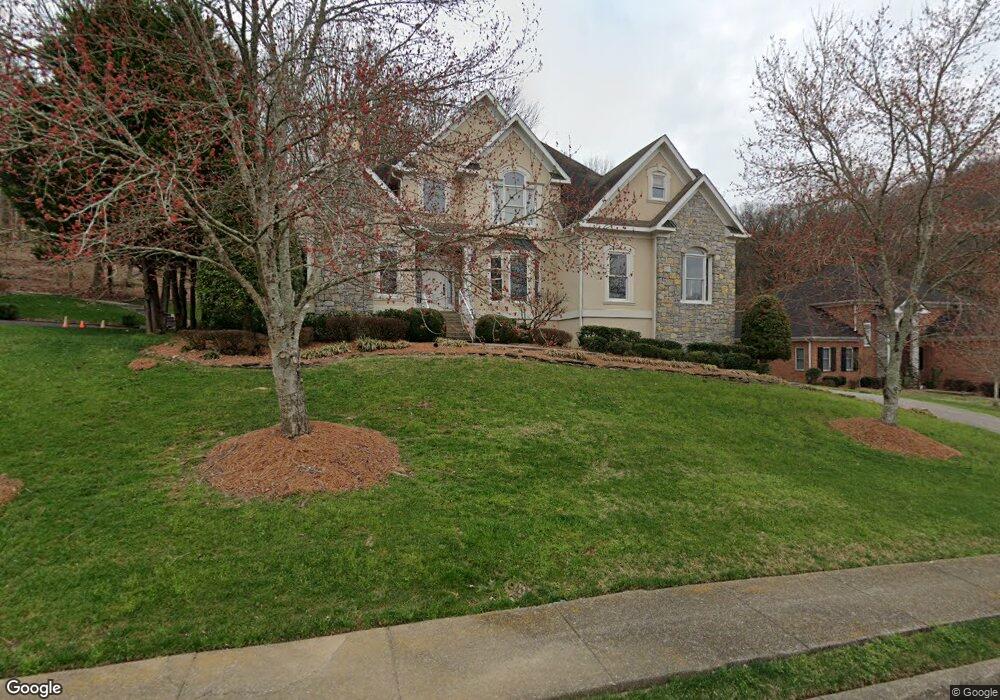
This home is located at 312 Chalford Ct, Franklin, TN 37069 and is currently estimated at $1,422,924, approximately $255 per square foot. 312 Chalford Ct is a home located in Williamson County with nearby schools including Grassland Elementary School, Grassland Middle School, and Franklin High School.
Ownership History
Date
Name
Owned For
Owner Type
Purchase Details
Closed on
Feb 3, 2003
Sold by
Rota Charles A and Rota Amanda D
Bought by
Crosson Martin and Crosson Carole
Current Estimated Value
Home Financials for this Owner
Home Financials are based on the most recent Mortgage that was taken out on this home.
Original Mortgage
$322,500
Outstanding Balance
$138,118
Interest Rate
5.95%
Estimated Equity
$1,284,806
Purchase Details
Closed on
Nov 4, 1998
Sold by
Hayes William J and Hayes Janet R
Bought by
Rota Charles A and Rota Amanda D
Home Financials for this Owner
Home Financials are based on the most recent Mortgage that was taken out on this home.
Original Mortgage
$210,000
Interest Rate
6.58%
Purchase Details
Closed on
Mar 28, 1997
Sold by
Krohn Homes Llc
Bought by
Hayes Janet R and Hayes William J
Purchase Details
Closed on
Jun 5, 1996
Sold by
Stonebridge Park Dev Llc
Bought by
Krohn Homes Llc
Create a Home Valuation Report for This Property
The Home Valuation Report is an in-depth analysis detailing your home's value as well as a comparison with similar homes in the area
Home Values in the Area
Average Home Value in this Area
Purchase History
| Date | Buyer | Sale Price | Title Company |
|---|---|---|---|
| Crosson Martin | $465,000 | First Title & Escrow Co Inc | |
| Rota Charles A | $430,000 | -- | |
| Hayes Janet R | $428,513 | -- | |
| Krohn Homes Llc | $66,900 | -- |
Source: Public Records
Mortgage History
| Date | Status | Borrower | Loan Amount |
|---|---|---|---|
| Open | Crosson Martin | $322,500 | |
| Previous Owner | Rota Charles A | $210,000 |
Source: Public Records
Tax History Compared to Growth
Tax History
| Year | Tax Paid | Tax Assessment Tax Assessment Total Assessment is a certain percentage of the fair market value that is determined by local assessors to be the total taxable value of land and additions on the property. | Land | Improvement |
|---|---|---|---|---|
| 2024 | $3,666 | $195,025 | $42,500 | $152,525 |
| 2023 | $3,666 | $195,025 | $42,500 | $152,525 |
| 2022 | $3,666 | $195,025 | $42,500 | $152,525 |
| 2021 | $3,666 | $195,025 | $42,500 | $152,525 |
| 2020 | $3,642 | $164,050 | $27,500 | $136,550 |
| 2019 | $3,642 | $164,050 | $27,500 | $136,550 |
| 2018 | $3,527 | $164,050 | $27,500 | $136,550 |
| 2017 | $3,527 | $164,050 | $27,500 | $136,550 |
| 2016 | $0 | $164,050 | $27,500 | $136,550 |
| 2015 | -- | $136,175 | $22,500 | $113,675 |
| 2014 | -- | $136,175 | $22,500 | $113,675 |
Source: Public Records
Map
Nearby Homes
- 216 Bramerton Ct
- 508 Chippenham Ct
- 1098 Stonebridge Park Dr
- 1024 Vaughn Crest Dr
- 105 Steeplechase Ln
- 104 Steeplechase Ln
- 106 Steeplechase Ln
- 322 Vaughn Rd
- 1023 Stockett Dr
- 0 Steeplechase Ln
- 3004 Strickland Dr
- 1413 Willowbrooke Cir
- 360 Vaughn Rd
- 0 Vaughn Rd
- 6525 Radcliff Dr
- 6313 Chickering Cir
- 6312 Chickering Cir
- 2864 Sawyer Bend Rd
- 236 Gardenridge Dr
- 113 Middleton Cir
- 308 Chalford Ct
- 316 Chalford Ct
- 304 Chalford Ct
- 320 Chalford Ct
- 313 Chalford Ct
- 317 Chalford Ct
- 309 Chalford Ct
- 321 Chalford Ct
- 325 Chalford Ct
- 305 Chalford Ct
- 1061 Stonebridge Park Dr
- 1065 Stonebridge Park Dr
- 1069 Stonebridge Park Dr
- 1055 Stonebridge Park Dr
- 212 Bramerton Ct
- 315 Chalford Ct
- 1049 Stonebridge Park Dr
- 208 Bramerton Ct
- 1071 Stonebridge Park Dr
- 220 Bramerton Ct