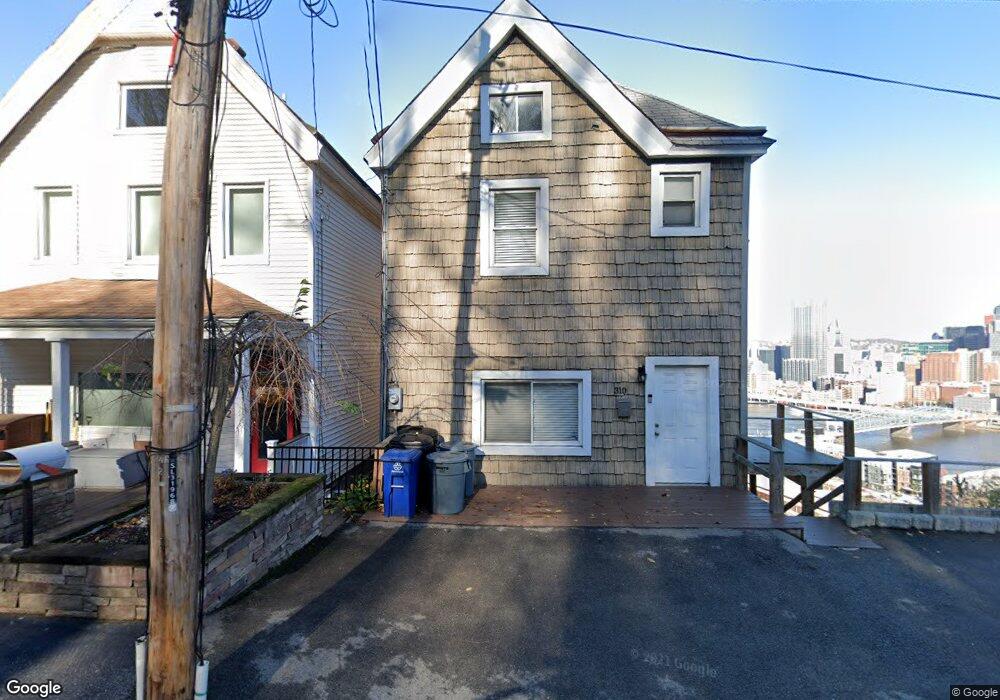
312 Cola St Pittsburgh, PA 15203
Mount Washington NeighborhoodEstimated Value: $195,000 - $640,000
2
Beds
1
Bath
1,500
Sq Ft
$274/Sq Ft
Est. Value
About This Home
This home is located at 312 Cola St, Pittsburgh, PA 15203 and is currently estimated at $411,552, approximately $274 per square foot. 312 Cola St is a home located in Allegheny County with nearby schools including Pittsburgh Whittier K-5, South Hills Middle School, and Pittsburgh Brashear High School.
Ownership History
Date
Name
Owned For
Owner Type
Purchase Details
Closed on
Nov 17, 2020
Sold by
Charles Tyler Jordan
Bought by
Charles Tyler Jordan and Debone Samantha
Current Estimated Value
Purchase Details
Closed on
Nov 28, 2016
Sold by
Owen James R and Owen Yheizzi
Bought by
Charles Tyler Jordan
Home Financials for this Owner
Home Financials are based on the most recent Mortgage that was taken out on this home.
Original Mortgage
$303,483
Outstanding Balance
$244,678
Interest Rate
3.47%
Mortgage Type
New Conventional
Estimated Equity
$166,874
Purchase Details
Closed on
Nov 30, 2006
Sold by
Mikluscak Andrew
Bought by
Owens James R
Create a Home Valuation Report for This Property
The Home Valuation Report is an in-depth analysis detailing your home's value as well as a comparison with similar homes in the area
Home Values in the Area
Average Home Value in this Area
Purchase History
| Date | Buyer | Sale Price | Title Company |
|---|---|---|---|
| Charles Tyler Jordan | -- | None Available | |
| Charles Tyler Jordan | $278,600 | Attorney | |
| Owens James R | $149,900 | -- |
Source: Public Records
Mortgage History
| Date | Status | Borrower | Loan Amount |
|---|---|---|---|
| Open | Charles Tyler Jordan | $303,483 |
Source: Public Records
Tax History Compared to Growth
Tax History
| Year | Tax Paid | Tax Assessment Tax Assessment Total Assessment is a certain percentage of the fair market value that is determined by local assessors to be the total taxable value of land and additions on the property. | Land | Improvement |
|---|---|---|---|---|
| 2025 | $5,011 | $217,500 | $140,700 | $76,800 |
| 2024 | $5,011 | $217,500 | $140,700 | $76,800 |
| 2023 | $5,011 | $217,500 | $140,700 | $76,800 |
| 2022 | $4,946 | $217,500 | $140,700 | $76,800 |
| 2021 | $5,000 | $217,500 | $140,700 | $76,800 |
| 2020 | $4,922 | $217,500 | $140,700 | $76,800 |
| 2019 | $4,922 | $217,500 | $140,700 | $76,800 |
| 2018 | $3,884 | $217,500 | $140,700 | $76,800 |
| 2017 | $4,435 | $196,000 | $140,700 | $55,300 |
| 2016 | $927 | $196,000 | $140,700 | $55,300 |
| 2015 | $927 | $196,000 | $140,700 | $55,300 |
| 2014 | $4,337 | $196,000 | $140,700 | $55,300 |
Source: Public Records
Map
Nearby Homes