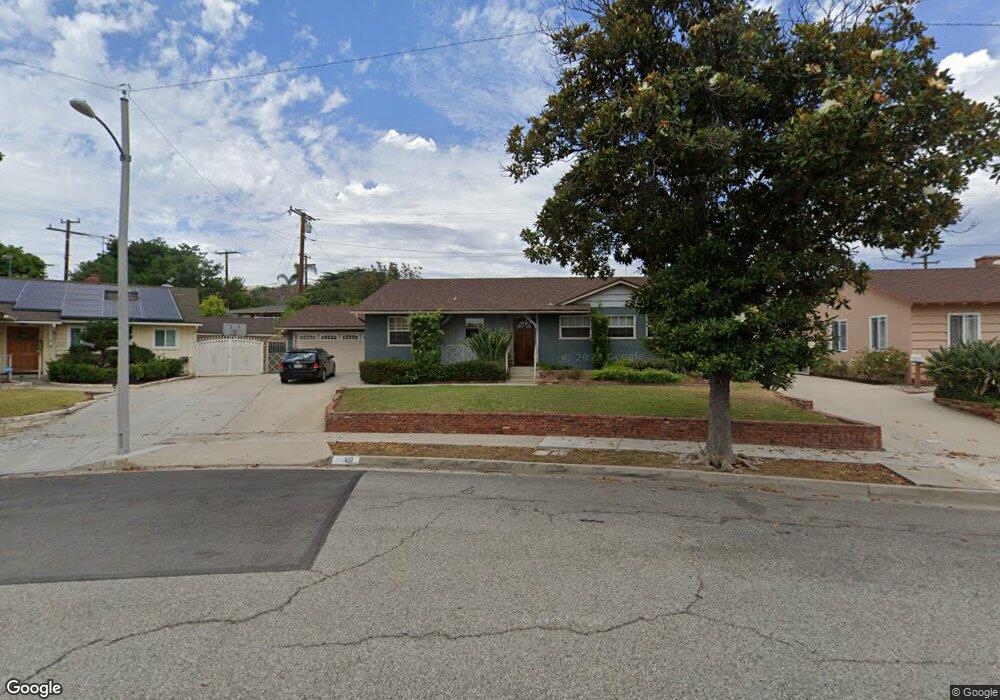
312 E View Crest Dr Montebello, CA 90640
Estimated Value: $830,000 - $938,000
3
Beds
2
Baths
1,650
Sq Ft
$528/Sq Ft
Est. Value
About This Home
This home is located at 312 E View Crest Dr, Montebello, CA 90640 and is currently estimated at $870,589, approximately $527 per square foot. 312 E View Crest Dr is a home located in Los Angeles County with nearby schools including La Merced Elementary School, La Merced Intermediate School, and Montebello High School.
Ownership History
Date
Name
Owned For
Owner Type
Purchase Details
Closed on
Dec 11, 2025
Sold by
Uranga Rachel G
Bought by
Rachel G Uranga Trust and Uranga
Current Estimated Value
Purchase Details
Closed on
Nov 17, 2025
Sold by
Uranga Rachel G and Carlos A Uranga Trust
Bought by
Uranga Rachel G
Purchase Details
Closed on
Jul 30, 2020
Sold by
Uranga Carlos A
Bought by
Uranga Carlos A and The Carlos Uranga Trust
Purchase Details
Closed on
Aug 11, 2003
Sold by
Chinarian Sam and Chinarian Geraldine B
Bought by
Uranga Carlos A
Home Financials for this Owner
Home Financials are based on the most recent Mortgage that was taken out on this home.
Original Mortgage
$320,000
Interest Rate
6.06%
Mortgage Type
Purchase Money Mortgage
Create a Home Valuation Report for This Property
The Home Valuation Report is an in-depth analysis detailing your home's value as well as a comparison with similar homes in the area
Home Values in the Area
Average Home Value in this Area
Purchase History
| Date | Buyer | Sale Price | Title Company |
|---|---|---|---|
| Rachel G Uranga Trust | -- | None Listed On Document | |
| Uranga Rachel G | -- | None Listed On Document | |
| Uranga Carlos A | -- | None Available | |
| Uranga Carlos A | $400,000 | Chicago Title Co |
Source: Public Records
Mortgage History
| Date | Status | Borrower | Loan Amount |
|---|---|---|---|
| Previous Owner | Uranga Carlos A | $320,000 | |
| Closed | Uranga Carlos A | $60,000 |
Source: Public Records
Tax History
| Year | Tax Paid | Tax Assessment Tax Assessment Total Assessment is a certain percentage of the fair market value that is determined by local assessors to be the total taxable value of land and additions on the property. | Land | Improvement |
|---|---|---|---|---|
| 2025 | $8,576 | $568,697 | $373,498 | $195,199 |
| 2024 | $8,293 | $557,547 | $366,175 | $191,372 |
| 2023 | $8,270 | $546,616 | $358,996 | $187,620 |
| 2022 | $7,991 | $535,899 | $351,957 | $183,942 |
| 2021 | $7,710 | $525,392 | $345,056 | $180,336 |
| 2019 | $7,377 | $509,810 | $334,822 | $174,988 |
| 2018 | $7,459 | $499,814 | $328,257 | $171,557 |
| 2016 | $7,143 | $480,408 | $315,511 | $164,897 |
| 2015 | $6,758 | $473,193 | $310,772 | $162,421 |
| 2014 | $6,663 | $463,925 | $304,685 | $159,240 |
Source: Public Records
Map
Nearby Homes
- 708 Katherine Dr
- 713 N Orcutt Dr
- 653 N Raywood Ave
- 704 N Poplar Ave
- 25 Remy Ln
- 105 Remy Ln
- 211 Peacock Ln
- 478 Sycamore Dr W
- 265 Remy Ln
- 115 Remy Ln
- 2058 Hollyleaf Terrace
- 318 Plume Way
- 217 Dochan Cir
- 615 Sage Way
- 495 Verbena Way
- 448 Marlow Ln
- 258 Sage Way
- 418 Marlow Ln
- 565 Canterbury Way
- 108 Verbena Way
- 316 E View Crest Dr
- 308 E View Crest Dr
- 309 E Avenida de la Merced
- 317 E Avenida de la Merced
- 305 E Avenida de la Merced
- 321 E Avenida de la Merced
- 320 E View Crest Dr
- 821 N View Crest Dr
- 317 E View Crest Dr
- 325 E Avenida de la Merced
- 817 N View Crest Dr
- 400 E View Crest Dr
- 816 N View Crest Dr
- 401 E Avenida de la Merced
- 325 E View Crest Dr
- 406 E View Crest Dr
- 401 E View Crest Dr
- 405 E Avenida de la Merced
- 812 N View Crest Dr
- 300 E Avenida de la Merced
Your Personal Tour Guide
Ask me questions while you tour the home.