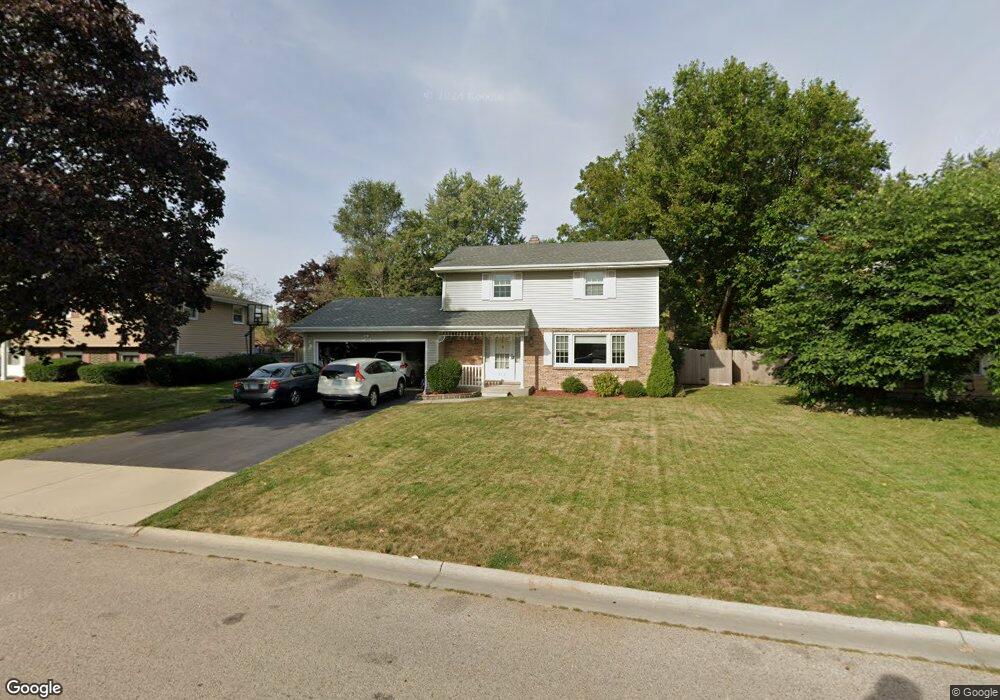
312 High Point Dr Lindenhurst, IL 60046
Estimated Value: $312,000 - $348,000
3
Beds
2
Baths
1,560
Sq Ft
$210/Sq Ft
Est. Value
About This Home
This home is located at 312 High Point Dr, Lindenhurst, IL 60046 and is currently estimated at $328,255, approximately $210 per square foot. 312 High Point Dr is a home located in Lake County with nearby schools including Lakes Community High School.
Ownership History
Date
Name
Owned For
Owner Type
Purchase Details
Closed on
Sep 22, 2003
Sold by
Kloeplfer Jeremy R and Kloepfer Jennifer D
Bought by
Bober Anthony M and Bober Cheryl L
Current Estimated Value
Home Financials for this Owner
Home Financials are based on the most recent Mortgage that was taken out on this home.
Original Mortgage
$228,000
Outstanding Balance
$107,149
Interest Rate
6.43%
Mortgage Type
Purchase Money Mortgage
Estimated Equity
$221,106
Purchase Details
Closed on
Nov 7, 2001
Sold by
Kloepfer Jeremy R
Bought by
Kloepfer Jeremy R and Kloepfer Jennifer D
Home Financials for this Owner
Home Financials are based on the most recent Mortgage that was taken out on this home.
Original Mortgage
$189,150
Interest Rate
6.92%
Mortgage Type
FHA
Purchase Details
Closed on
Sep 21, 2001
Sold by
Sullivan Michael J and Sullivan Colleen T
Bought by
Kloepfer Jeremy R
Home Financials for this Owner
Home Financials are based on the most recent Mortgage that was taken out on this home.
Original Mortgage
$189,150
Interest Rate
6.92%
Mortgage Type
FHA
Purchase Details
Closed on
Apr 22, 1994
Sold by
Tasker Andrew S
Bought by
Sullivan Michael J and Sullivan Colleen T
Home Financials for this Owner
Home Financials are based on the most recent Mortgage that was taken out on this home.
Original Mortgage
$134,000
Interest Rate
6.5%
Create a Home Valuation Report for This Property
The Home Valuation Report is an in-depth analysis detailing your home's value as well as a comparison with similar homes in the area
Home Values in the Area
Average Home Value in this Area
Purchase History
| Date | Buyer | Sale Price | Title Company |
|---|---|---|---|
| Bober Anthony M | $240,000 | First American Title | |
| Kloepfer Jeremy R | -- | -- | |
| Kloepfer Jeremy R | $192,500 | -- | |
| Sullivan Michael J | $94,333 | -- |
Source: Public Records
Mortgage History
| Date | Status | Borrower | Loan Amount |
|---|---|---|---|
| Open | Bober Anthony M | $228,000 | |
| Previous Owner | Kloepfer Jeremy R | $189,150 | |
| Previous Owner | Sullivan Michael J | $134,000 |
Source: Public Records
Tax History
| Year | Tax Paid | Tax Assessment Tax Assessment Total Assessment is a certain percentage of the fair market value that is determined by local assessors to be the total taxable value of land and additions on the property. | Land | Improvement |
|---|---|---|---|---|
| 2024 | $7,720 | $87,614 | $13,436 | $74,178 |
| 2023 | $6,882 | $77,411 | $11,871 | $65,540 |
| 2022 | $6,882 | $66,270 | $11,019 | $55,251 |
| 2021 | $6,533 | $61,561 | $10,236 | $51,325 |
| 2020 | $6,381 | $59,589 | $9,908 | $49,681 |
| 2019 | $6,533 | $57,269 | $9,522 | $47,747 |
| 2018 | $6,317 | $57,492 | $13,941 | $43,551 |
| 2017 | $6,146 | $55,959 | $13,569 | $42,390 |
| 2016 | $6,266 | $53,694 | $13,020 | $40,674 |
| 2015 | $5,975 | $50,148 | $12,160 | $37,988 |
| 2014 | $6,361 | $48,471 | $12,215 | $36,256 |
| 2012 | $5,919 | $57,366 | $13,892 | $43,474 |
Source: Public Records
Map
Nearby Homes
- 2312 High Point Dr
- 533 N Beck Rd Unit 28
- 1809 Maplewood Ct
- 527 Northgate Rd Unit 28
- 210 Hazelwood Dr
- 102 Hawthorne Dr
- 1811 Longmeadow Dr Unit 17
- 1906 Fairfield Rd
- 1900 Burr Oak Ln Unit 15
- 2022 Woodlane Dr
- 405 Woodland Trail
- 73 S Beck Rd
- 420 Woodland Trail
- 428 Woodland Trail
- 434 Woodland Trail
- 433 Woodland Trail
- 200 S Beck Rd Unit 12
- 38740 N Anderle Ave
- 151 Rose Tree Ln
- 1896 E Vista Terrace
- 314 High Point Dr
- 310 High Point Dr
- 399 Northgate Rd
- 401 Northgate Rd
- 397 Northgate Rd
- 308 High Point Dr Unit 27
- 403 Northgate Rd
- 316 High Point Dr Unit 27
- 395 Northgate Rd
- 319 High Point Dr
- 321 High Point Dr
- 403 Surrey Ln Unit 27
- 317 High Point Dr
- 405 Northgate Rd
- 323 High Point Dr
- 393 Northgate Rd
- 405 Surrey Ln
- 306 High Point Dr
- 327 High Point Dr
- 315 High Point Dr
Your Personal Tour Guide
Ask me questions while you tour the home.