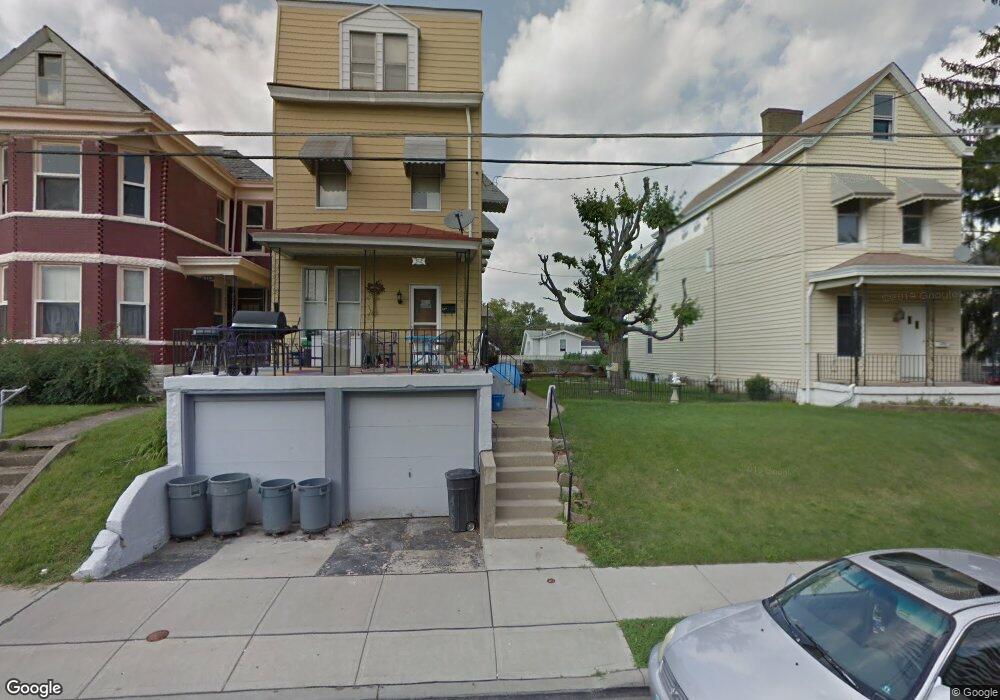
312 Jefferson Ave Cincinnati, OH 45217
Estimated Value: $248,000 - $277,674
2
Beds
4
Baths
2,502
Sq Ft
$105/Sq Ft
Est. Value
About This Home
This home is located at 312 Jefferson Ave, Cincinnati, OH 45217 and is currently estimated at $261,669, approximately $104 per square foot. 312 Jefferson Ave is a home located in Hamilton County with nearby schools including St Bernard Elementary School, St Bernard-Elmwood Place High School, and The New School.
Ownership History
Date
Name
Owned For
Owner Type
Purchase Details
Closed on
Nov 12, 2002
Sold by
Martigetti Mary E
Bought by
Phillips Virginia I and Kunz Dorothy
Current Estimated Value
Home Financials for this Owner
Home Financials are based on the most recent Mortgage that was taken out on this home.
Original Mortgage
$106,600
Outstanding Balance
$44,847
Interest Rate
6.08%
Mortgage Type
FHA
Estimated Equity
$216,822
Purchase Details
Closed on
Aug 30, 1996
Sold by
Howell James C
Bought by
Martignetti Mary E
Home Financials for this Owner
Home Financials are based on the most recent Mortgage that was taken out on this home.
Original Mortgage
$76,764
Interest Rate
8.29%
Mortgage Type
FHA
Create a Home Valuation Report for This Property
The Home Valuation Report is an in-depth analysis detailing your home's value as well as a comparison with similar homes in the area
Home Values in the Area
Average Home Value in this Area
Purchase History
| Date | Buyer | Sale Price | Title Company |
|---|---|---|---|
| Phillips Virginia I | $107,500 | First Title Agency Inc | |
| Martignetti Mary E | $78,500 | -- |
Source: Public Records
Mortgage History
| Date | Status | Borrower | Loan Amount |
|---|---|---|---|
| Open | Phillips Virginia I | $106,600 | |
| Closed | Martignetti Mary E | $76,764 |
Source: Public Records
Tax History Compared to Growth
Tax History
| Year | Tax Paid | Tax Assessment Tax Assessment Total Assessment is a certain percentage of the fair market value that is determined by local assessors to be the total taxable value of land and additions on the property. | Land | Improvement |
|---|---|---|---|---|
| 2024 | $3,343 | $56,774 | $11,578 | $45,196 |
| 2023 | $3,489 | $56,774 | $11,578 | $45,196 |
| 2022 | $2,941 | $37,174 | $9,030 | $28,144 |
| 2021 | $2,867 | $37,174 | $9,030 | $28,144 |
| 2020 | $2,839 | $37,174 | $9,030 | $28,144 |
| 2019 | $2,638 | $31,774 | $7,718 | $24,056 |
| 2018 | $2,681 | $31,774 | $7,718 | $24,056 |
| 2017 | $2,530 | $31,774 | $7,718 | $24,056 |
| 2016 | $1,561 | $19,702 | $9,090 | $10,612 |
| 2015 | $1,465 | $19,702 | $9,090 | $10,612 |
| 2014 | $1,463 | $19,702 | $9,090 | $10,612 |
| 2013 | $1,498 | $20,741 | $9,569 | $11,172 |
Source: Public Records
Map
Nearby Homes
- 421 Jefferson Ave
- 406 Washington Ave
- 4409 Sullivan Ave
- 320 Mcclelland Ave
- 208 Mcclelland Ave
- 4910 Greenlee Ave
- 535 Church St
- 27 Phillips Ave
- 508 Advance Ave
- 515 Advance Ave
- 5136 Broerman Ave
- 709 Avon Fields Ln
- 15 Bertus St
- 130 Baker Ave
- 130 Mary Ln
- 5140 Imwalle Ave
- 4901 Chalet Dr
- 4903 Chalet Dr
- 52 E Mitchell Ave
- 745 Avon Fields Ln
- 316 Jefferson Ave
- 310 Jefferson Ave
- 308 Jefferson Ave
- 320 Jefferson Ave
- 306 Jefferson Ave
- 304 Jefferson Ave
- 317 Jackson Ave
- 315 Jackson Ave
- 321 Jackson Ave
- 309 Jackson Ave
- 302 Jefferson Ave
- 4610 Sullivan Ave
- 313 Jefferson Ave
- 317 Jefferson Ave
- 311 Jefferson Ave
- 4614 Sullivan Ave
- 309 Jefferson Ave
- 4616 Sullivan Ave
- 401 Jackson Ave
- 307 Jefferson Ave