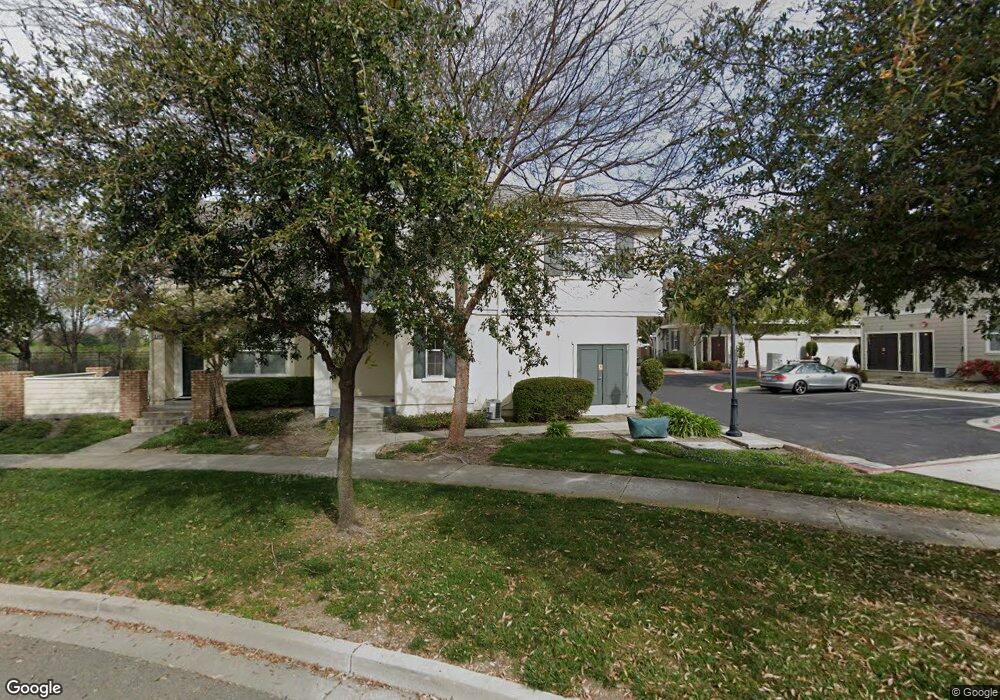
312 Joree Ln Unit 16 San Ramon, CA 94582
Gale Ranch-Windemere NeighborhoodEstimated Value: $1,009,765 - $1,054,000
3
Beds
3
Baths
1,605
Sq Ft
$637/Sq Ft
Est. Value
About This Home
This home is located at 312 Joree Ln Unit 16, San Ramon, CA 94582 and is currently estimated at $1,022,191, approximately $636 per square foot. 312 Joree Ln Unit 16 is a home located in Contra Costa County with nearby schools including Bella Vista Elementary School, Windemere Ranch Middle School, and Dougherty Valley High School.
Ownership History
Date
Name
Owned For
Owner Type
Purchase Details
Closed on
Apr 5, 2018
Sold by
Kaplan Gary
Bought by
Kaplan Gary
Current Estimated Value
Purchase Details
Closed on
Mar 7, 2012
Sold by
Tercioglu Orhan M and Tercioglu Suna A
Bought by
Kaplan Gary
Purchase Details
Closed on
Aug 20, 2004
Sold by
Tercioglu Suna A
Bought by
Tercioglu Orhan M and Tercioglu Suna A
Home Financials for this Owner
Home Financials are based on the most recent Mortgage that was taken out on this home.
Original Mortgage
$479,200
Interest Rate
3.12%
Mortgage Type
Purchase Money Mortgage
Purchase Details
Closed on
Aug 17, 2004
Sold by
Western Pacific Housing Windemere
Bought by
Tercioglu Suna A
Home Financials for this Owner
Home Financials are based on the most recent Mortgage that was taken out on this home.
Original Mortgage
$479,200
Interest Rate
3.12%
Mortgage Type
Purchase Money Mortgage
Create a Home Valuation Report for This Property
The Home Valuation Report is an in-depth analysis detailing your home's value as well as a comparison with similar homes in the area
Home Values in the Area
Average Home Value in this Area
Purchase History
| Date | Buyer | Sale Price | Title Company |
|---|---|---|---|
| Kaplan Gary | -- | None Available | |
| Kaplan Gary | $325,000 | Fidelity National Title Co | |
| Tercioglu Orhan M | -- | First American Title | |
| Tercioglu Suna A | $599,000 | First American Title | |
| Tercioglu Suna A | -- | First American Title |
Source: Public Records
Mortgage History
| Date | Status | Borrower | Loan Amount |
|---|---|---|---|
| Previous Owner | Tercioglu Suna A | $479,200 | |
| Closed | Tercioglu Suna A | $59,900 |
Source: Public Records
Tax History Compared to Growth
Tax History
| Year | Tax Paid | Tax Assessment Tax Assessment Total Assessment is a certain percentage of the fair market value that is determined by local assessors to be the total taxable value of land and additions on the property. | Land | Improvement |
|---|---|---|---|---|
| 2025 | $7,767 | $408,205 | $251,206 | $156,999 |
| 2024 | $7,641 | $400,202 | $246,281 | $153,921 |
| 2023 | $7,641 | $392,355 | $241,452 | $150,903 |
| 2022 | $7,515 | $384,663 | $236,718 | $147,945 |
| 2021 | $7,311 | $377,122 | $232,077 | $145,045 |
| 2019 | $7,084 | $365,939 | $225,195 | $140,744 |
| 2018 | $6,866 | $358,765 | $220,780 | $137,985 |
| 2017 | $6,719 | $351,731 | $216,451 | $135,280 |
| 2016 | $6,617 | $344,835 | $212,207 | $132,628 |
| 2015 | $6,505 | $339,656 | $209,020 | $130,636 |
| 2014 | $6,418 | $333,004 | $204,926 | $128,078 |
Source: Public Records
Map
Nearby Homes
- 1412 Arianna Ln
- 2073 Watermill Rd
- 1038 S Monarch Rd
- 6260 Main Branch Rd
- 1236 Andreas Way
- 2165 Watermill Rd Unit 54
- 3221 Browntail Way
- 6132 Alpine Blue Dr
- 3422 Cinnamon Ridge Rd
- 5132 Fioli Loop
- 5300 Fioli Loop
- 224 Riverland Ct
- 2308 Cedarwood Loop
- 1628 Banbury Dr
- 406 Glastonbury Ct
- 3056 Silva Way
- 3638 Sandalford Way
- 5430 Sherwood Way
- 6130 Yardley Ln
- 1615 Lawrence Rd
- 313 Joree Ln Unit 15
- 311 Joree Ln Unit 17
- 310 Joree Ln
- 314 Joree Ln Unit 14
- 315 Joree Ln
- 115 Arianna Ln
- 215 Arianna Ln
- 410 Joree Ln Unit 23
- 410 Joree Ln
- 114 Arianna Ln Unit 5
- 214 Arianna Ln
- 113 Arianna Ln
- 412 Joree Ln
- 213 Arianna Ln Unit 9
- 112 Arianna Ln Unit 3
- 212 Arianna Ln
- 413 Joree Ln Unit 20
- 414 Joree Ln Unit 19
- 111 Arianna Ln Unit 2
- 110 Arianna Ln