Estimated Value: $173,000 - $257,134
3
Beds
3
Baths
1,372
Sq Ft
$160/Sq Ft
Est. Value
About This Home
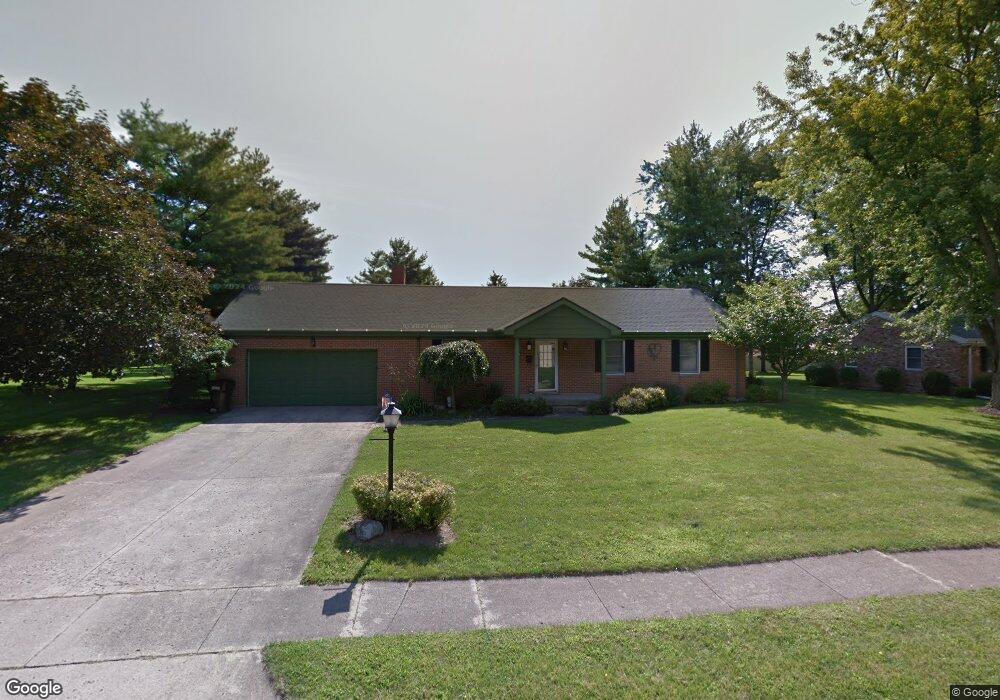
This home is located at 312 Lutheran Dr, Eaton, OH 45320 and is currently estimated at $219,034, approximately $159 per square foot. 312 Lutheran Dr is a home located in Preble County with nearby schools including Hollingsworth East Elementary School, William Bruce Elementary School, and Eaton Middle School.
Ownership History
Date
Name
Owned For
Owner Type
Purchase Details
Closed on
Jul 12, 2022
Sold by
Garber Timothy J and Garber Barbara E
Bought by
Mcdermitt Christeena A and Mcdermitt William R
Current Estimated Value
Home Financials for this Owner
Home Financials are based on the most recent Mortgage that was taken out on this home.
Original Mortgage
$210,123
Outstanding Balance
$201,098
Interest Rate
5.81%
Mortgage Type
FHA
Estimated Equity
$17,936
Purchase Details
Closed on
Feb 16, 2001
Sold by
Roth Gregory
Bought by
Garber Timothy J and Garber Barbara
Home Financials for this Owner
Home Financials are based on the most recent Mortgage that was taken out on this home.
Original Mortgage
$102,400
Interest Rate
7.1%
Mortgage Type
New Conventional
Purchase Details
Closed on
Nov 28, 1986
Bought by
Garber Timothy J and Garber Barbara E
Create a Home Valuation Report for This Property
The Home Valuation Report is an in-depth analysis detailing your home's value as well as a comparison with similar homes in the area
Home Values in the Area
Average Home Value in this Area
Purchase History
| Date | Buyer | Sale Price | Title Company |
|---|---|---|---|
| Mcdermitt Christeena A | $333 | Vantage Land Title | |
| Garber Timothy J | $128,000 | -- | |
| Garber Timothy J | $75,000 | -- |
Source: Public Records
Mortgage History
| Date | Status | Borrower | Loan Amount |
|---|---|---|---|
| Open | Mcdermitt Christeena A | $210,123 | |
| Previous Owner | Garber Timothy J | $102,400 |
Source: Public Records
Tax History Compared to Growth
Tax History
| Year | Tax Paid | Tax Assessment Tax Assessment Total Assessment is a certain percentage of the fair market value that is determined by local assessors to be the total taxable value of land and additions on the property. | Land | Improvement |
|---|---|---|---|---|
| 2024 | $2,403 | $68,920 | $12,220 | $56,700 |
| 2023 | $2,403 | $68,920 | $12,220 | $56,700 |
| 2022 | $2,261 | $53,550 | $8,820 | $44,730 |
| 2021 | $2,432 | $53,550 | $8,820 | $44,730 |
| 2020 | $2,339 | $53,550 | $8,820 | $44,730 |
| 2019 | $2,068 | $46,730 | $8,020 | $38,710 |
| 2018 | $2,083 | $46,730 | $8,020 | $38,710 |
| 2017 | $1,983 | $46,730 | $8,020 | $38,710 |
| 2016 | $1,877 | $45,540 | $7,810 | $37,730 |
| 2014 | $1,845 | $45,540 | $7,810 | $37,730 |
| 2013 | $1,907 | $45,535 | $7,805 | $37,730 |
Source: Public Records
Map
Nearby Homes
- 115 Woodland Dr
- 405 Walnut St
- 308 Hubble St
- 124 Deem St
- 331 W Chicago St
- 111 W High St
- 233 N Barron St
- 230 W Spring St
- 210 W Spring St
- 115 E Decatur St
- 125 E Decatur St
- 0-00 Washington Jackson Rd
- 612 N Cherry St
- 919 N Barron St
- 219 E High St
- 217 E Eidson St
- 414 N Maple St
- 105 Leatherman Place
- 130 E Chicago St
- 1008 N Maple St
- 308 Lutheran Dr
- 316 Lutheran Dr
- 309 Cheryl Ct
- 313 Cheryl Ct
- 313 Lutheran Dr
- 317 Lutheran Dr
- 304 Lutheran Dr
- 320 Lutheran Dr
- 309 Lutheran Dr
- 305 Cheryl Ct
- 321 Lutheran Dr
- 305 Lutheran Dr
- 312 Cheryl Ct
- 224 Lutheran Dr
- 325 Lutheran Dr
- 220 Lutheran Dr
- 308 Cheryl Ct
- 301 Lutheran Dr
- 304 Cheryl Ct
- 503 Hallmark Dr