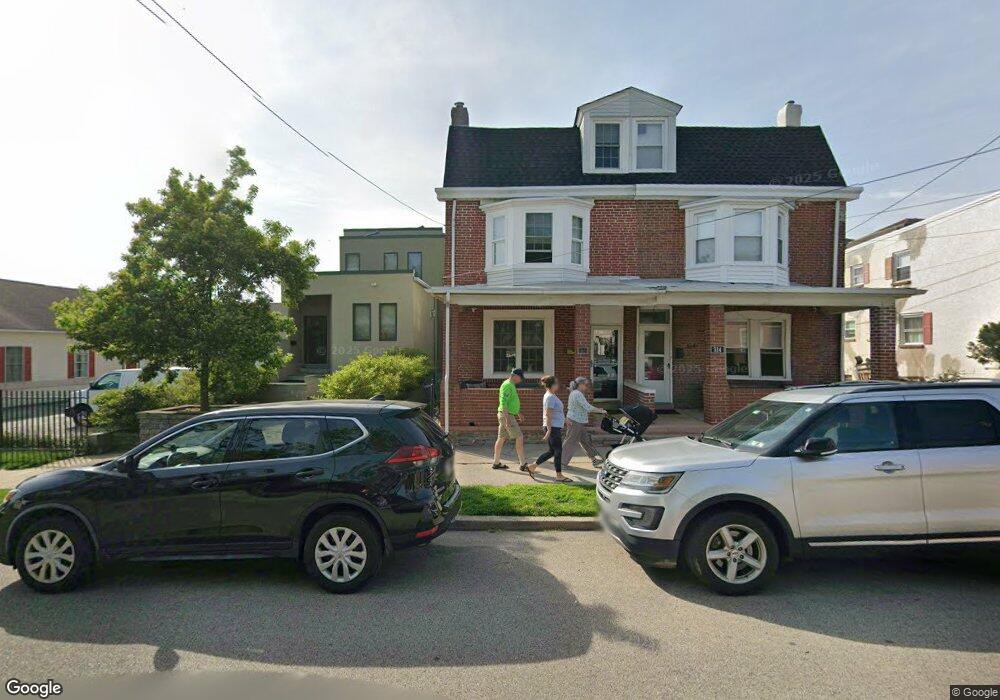
312 Maple St Conshohocken, PA 19428
Estimated Value: $485,000 - $585,000
5
Beds
2
Baths
1,512
Sq Ft
$357/Sq Ft
Est. Value
About This Home
This home is located at 312 Maple St, Conshohocken, PA 19428 and is currently estimated at $539,197, approximately $356 per square foot. 312 Maple St is a home located in Montgomery County with nearby schools including Conshohocken Elementary School, Colonial Elementary School, and Colonial Middle School.
Ownership History
Date
Name
Owned For
Owner Type
Purchase Details
Closed on
Apr 17, 2020
Sold by
Catania Construction Llc
Bought by
Demas John and Demas Alyson B
Current Estimated Value
Home Financials for this Owner
Home Financials are based on the most recent Mortgage that was taken out on this home.
Original Mortgage
$370,800
Outstanding Balance
$329,102
Interest Rate
3.5%
Mortgage Type
New Conventional
Estimated Equity
$210,096
Purchase Details
Closed on
Sep 3, 2019
Sold by
Terrance J Manopello Estate
Bought by
Catania Construction Llc
Home Financials for this Owner
Home Financials are based on the most recent Mortgage that was taken out on this home.
Original Mortgage
$228,000
Interest Rate
3.7%
Mortgage Type
Construction
Purchase Details
Closed on
Aug 28, 1998
Sold by
Benedict Albert P and Benedetto Albert P
Bought by
Manopello Terrance J
Create a Home Valuation Report for This Property
The Home Valuation Report is an in-depth analysis detailing your home's value as well as a comparison with similar homes in the area
Home Values in the Area
Average Home Value in this Area
Purchase History
| Date | Buyer | Sale Price | Title Company |
|---|---|---|---|
| Demas John | $420,800 | None Available | |
| Catania Construction Llc | $208,000 | None Available | |
| Manopello Terrance J | $105,000 | -- |
Source: Public Records
Mortgage History
| Date | Status | Borrower | Loan Amount |
|---|---|---|---|
| Open | Demas John | $370,800 | |
| Previous Owner | Catania Construction Llc | $228,000 |
Source: Public Records
Tax History Compared to Growth
Tax History
| Year | Tax Paid | Tax Assessment Tax Assessment Total Assessment is a certain percentage of the fair market value that is determined by local assessors to be the total taxable value of land and additions on the property. | Land | Improvement |
|---|---|---|---|---|
| 2025 | $3,745 | $107,900 | -- | -- |
| 2024 | $3,745 | $107,900 | -- | -- |
| 2023 | $3,617 | $107,900 | $0 | $0 |
| 2022 | $3,540 | $107,900 | $0 | $0 |
| 2021 | $3,441 | $107,900 | $0 | $0 |
| 2020 | $3,099 | $102,900 | $29,170 | $73,730 |
| 2019 | $3,011 | $102,900 | $29,170 | $73,730 |
| 2018 | $756 | $102,900 | $29,170 | $73,730 |
| 2017 | $2,913 | $102,900 | $29,170 | $73,730 |
| 2016 | $2,873 | $102,900 | $29,170 | $73,730 |
| 2015 | $2,753 | $102,900 | $29,170 | $73,730 |
| 2014 | $2,753 | $102,900 | $29,170 | $73,730 |
Source: Public Records
Map
Nearby Homes
- 121 W 2nd Ave
- 148 W 1st Ave
- 135 W 1st Ave
- 117 Colwell Ln
- 635 Wood St
- 350 W Elm St Unit 3207
- 200 W Elm St Unit 1418
- 79 Harry St
- 453 Old Elm St
- 33 E 8th Ave Unit 55
- 454 W 6th Ave
- 463 New Elm St
- 302 E Elm St
- 333 E Hector St
- 369 Spring Mill Ave
- 378 E Hector St
- 369 E Hector St
- 222 E 7th Ave
- 318 E 6th Ave
- 219 W 11th Ave
- 314 Maple St Unit 13
- 310 Maple St
- 316 Maple St
- 318 Maple St
- 214 W 3rd Ave Unit 2 FL
- 214 W 3rd Ave
- 214 W 3rd Ave Unit FIRST FLOOR, REAR
- 214 W 3rd Ave Unit FRONT
- 214 W 3rd Ave Unit FIRST FLOOR, BACK
- 214 W 3rd Ave Unit 1ST FLOOR
- 322 Maple St
- 218 W 3rd Ave
- 148 W 3rd Ave
- 215 W 4th Ave
- 317 Maple St
- 328 Maple St
- 126 W 3rd Ave
- 146 W 3rd Ave
- 217 W 4th Ave
- 222 W 3rd Ave