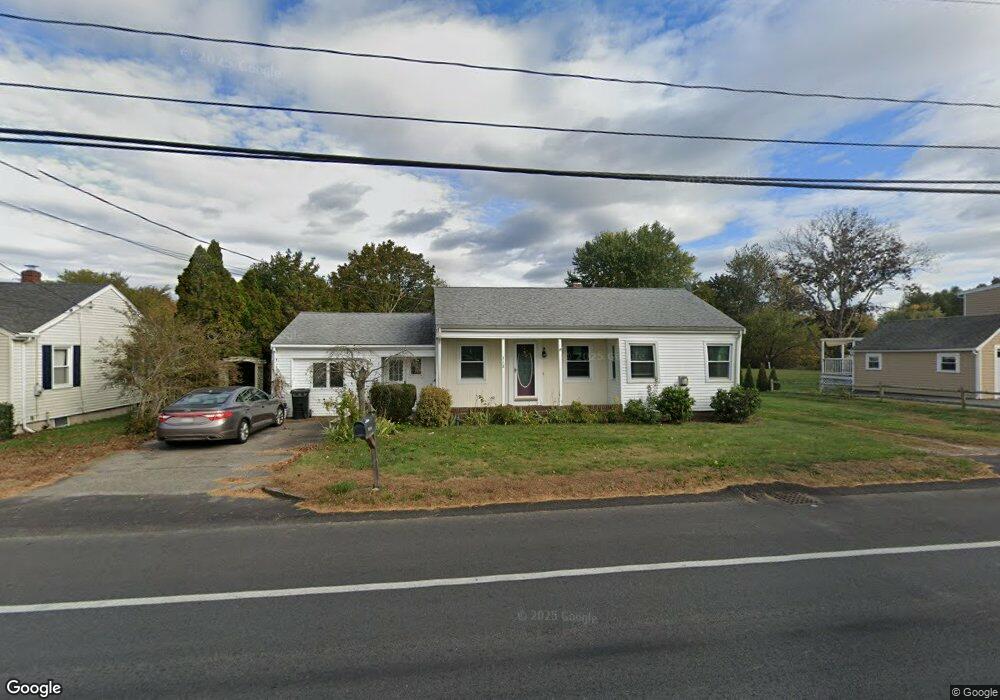
312 Market St Swansea, MA 02777
North Swansea NeighborhoodEstimated Value: $431,000 - $499,000
2
Beds
2
Baths
1,256
Sq Ft
$373/Sq Ft
Est. Value
About This Home
This home is located at 312 Market St, Swansea, MA 02777 and is currently estimated at $468,563, approximately $373 per square foot. 312 Market St is a home located in Bristol County with nearby schools including Joseph Case High School, Highlander Charter Middle and High School, and East Bay Career Academy.
Ownership History
Date
Name
Owned For
Owner Type
Purchase Details
Closed on
Jul 14, 2011
Sold by
Ferrira Inez M and Ferrira Charles
Bought by
Croce James
Current Estimated Value
Home Financials for this Owner
Home Financials are based on the most recent Mortgage that was taken out on this home.
Original Mortgage
$186,300
Outstanding Balance
$128,592
Interest Rate
4.58%
Mortgage Type
Purchase Money Mortgage
Estimated Equity
$339,971
Create a Home Valuation Report for This Property
The Home Valuation Report is an in-depth analysis detailing your home's value as well as a comparison with similar homes in the area
Home Values in the Area
Average Home Value in this Area
Purchase History
| Date | Buyer | Sale Price | Title Company |
|---|---|---|---|
| Croce James | $186,300 | -- |
Source: Public Records
Mortgage History
| Date | Status | Borrower | Loan Amount |
|---|---|---|---|
| Open | Croce James | $186,300 |
Source: Public Records
Tax History Compared to Growth
Tax History
| Year | Tax Paid | Tax Assessment Tax Assessment Total Assessment is a certain percentage of the fair market value that is determined by local assessors to be the total taxable value of land and additions on the property. | Land | Improvement |
|---|---|---|---|---|
| 2025 | $4,363 | $366,000 | $177,000 | $189,000 |
| 2024 | $4,316 | $360,000 | $177,000 | $183,000 |
| 2023 | $4,040 | $307,700 | $129,500 | $178,200 |
| 2022 | $4,029 | $280,000 | $117,800 | $162,200 |
| 2021 | $3,586 | $229,400 | $100,200 | $129,200 |
| 2020 | $3,554 | $228,100 | $100,200 | $127,900 |
| 2019 | $3,291 | $212,200 | $84,300 | $127,900 |
| 2018 | $3,093 | $202,400 | $83,000 | $119,400 |
| 2017 | $2,756 | $207,500 | $88,100 | $119,400 |
| 2016 | $2,768 | $204,700 | $89,200 | $115,500 |
| 2015 | $2,551 | $194,300 | $89,200 | $105,100 |
| 2014 | $2,510 | $195,500 | $89,200 | $106,300 |
Source: Public Records
Map
Nearby Homes
- 0 Old Fall River Rd Unit 73399047
- 24 Nod Rd
- 107 & 107R Walker
- 10 Quaker Ln
- 147 Bushee Rd
- 7 Cheshire Dr
- 27 Christine Dr
- 249 Barneyville Rd
- 1 Cedarbrook Unit A
- 5 Connor Ln
- 292 Sowams Rd
- 20 Burr Ave
- 17 Sassafras Rd
- 195 Barney Ave
- 192 Schoolhouse Rd
- 383 Vinnicum Rd
- 15 George w Finnerty Rd
- 0 Lillis Ave
- 1405 Gar Hwy Unit A
- 0 Hampden St
- 302 Market St
- 322 Market St
- 322 Market St Unit 1
- 300 Market St
- 330 Market St
- 282 Market St
- 350 Market St
- 340 Market St
- 349 Market St
- 33 Market St
- 270 Stoney Hill Rd
- 364 Market St
- 363 Market St
- 256 Stoney Hill Rd
- 263 Stoney Hill Rd
- 256 Market St
- 376 Market St
- 378 Market St
- 11 Anthony James Ct
- 253 Stoney Hill Rd