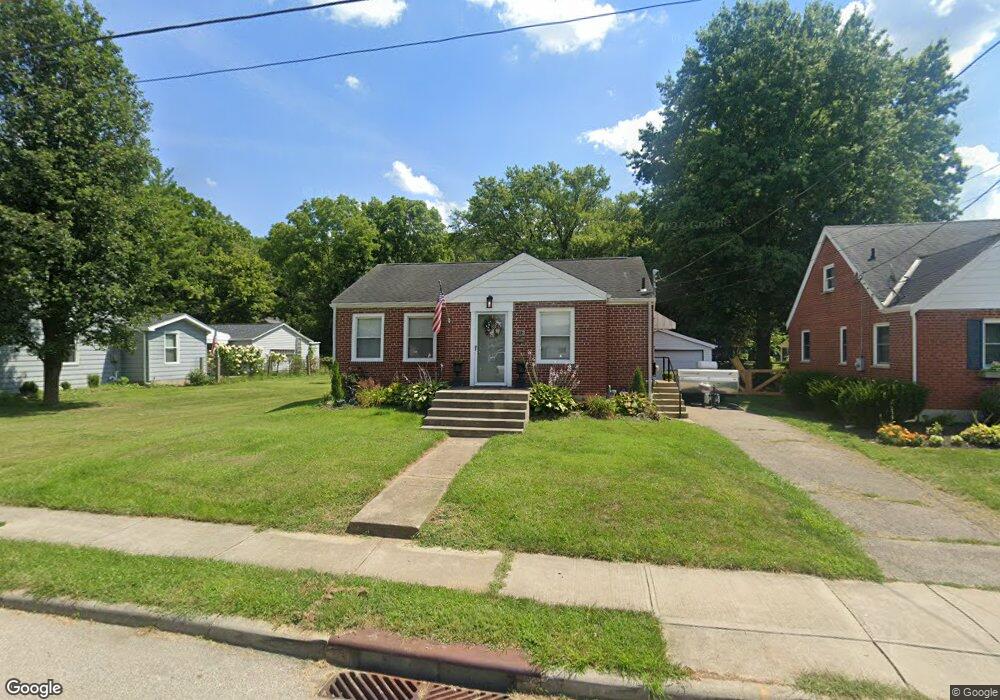
312 N Jefferson St Harrison, OH 45030
Estimated Value: $182,000 - $205,000
2
Beds
1
Bath
852
Sq Ft
$228/Sq Ft
Est. Value
About This Home
This home is located at 312 N Jefferson St, Harrison, OH 45030 and is currently estimated at $194,208, approximately $227 per square foot. 312 N Jefferson St is a home located in Hamilton County with nearby schools including William Henry Harrison High School, St. John The Baptist School, and Summit Academy of Southwest Ohio.
Ownership History
Date
Name
Owned For
Owner Type
Purchase Details
Closed on
Jun 12, 2025
Sold by
Bibbo Robert and Searcy Amy
Bought by
Searcy Amy
Current Estimated Value
Purchase Details
Closed on
Nov 30, 2022
Sold by
Vinson Anna Marie
Bought by
Bibbo Robert and Searcy Amy
Home Financials for this Owner
Home Financials are based on the most recent Mortgage that was taken out on this home.
Original Mortgage
$156,750
Interest Rate
6.95%
Mortgage Type
New Conventional
Purchase Details
Closed on
May 4, 2020
Sold by
Hoffman Mark E and Hoffman Joelle M
Bought by
Gabbard Anna Marie
Home Financials for this Owner
Home Financials are based on the most recent Mortgage that was taken out on this home.
Original Mortgage
$116,400
Interest Rate
3.5%
Mortgage Type
New Conventional
Purchase Details
Closed on
Sep 12, 2002
Sold by
Rolfes Debra S and Rolfes Diane L
Bought by
Hoffman Mark E and Hoffman Joelle E
Home Financials for this Owner
Home Financials are based on the most recent Mortgage that was taken out on this home.
Original Mortgage
$89,800
Interest Rate
6.37%
Mortgage Type
Unknown
Create a Home Valuation Report for This Property
The Home Valuation Report is an in-depth analysis detailing your home's value as well as a comparison with similar homes in the area
Home Values in the Area
Average Home Value in this Area
Purchase History
| Date | Buyer | Sale Price | Title Company |
|---|---|---|---|
| Searcy Amy | -- | None Listed On Document | |
| Searcy Amy | -- | None Listed On Document | |
| Bibbo Robert | $165,000 | Northwest Title | |
| Gabbard Anna Marie | $120,000 | None Available | |
| Hoffman Mark E | $89,000 | -- |
Source: Public Records
Mortgage History
| Date | Status | Borrower | Loan Amount |
|---|---|---|---|
| Previous Owner | Bibbo Robert | $156,750 | |
| Previous Owner | Gabbard Anna Marie | $116,400 | |
| Previous Owner | Hoffman Mark E | $89,800 |
Source: Public Records
Tax History Compared to Growth
Tax History
| Year | Tax Paid | Tax Assessment Tax Assessment Total Assessment is a certain percentage of the fair market value that is determined by local assessors to be the total taxable value of land and additions on the property. | Land | Improvement |
|---|---|---|---|---|
| 2024 | $2,576 | $57,751 | $10,084 | $47,667 |
| 2023 | $2,595 | $57,751 | $10,084 | $47,667 |
| 2022 | $2,154 | $42,000 | $9,877 | $32,123 |
| 2021 | $2,134 | $42,000 | $9,877 | $32,123 |
| 2020 | $2,214 | $42,000 | $9,877 | $32,123 |
| 2019 | $1,456 | $26,306 | $8,232 | $18,074 |
| 2018 | $1,463 | $26,306 | $8,232 | $18,074 |
| 2017 | $1,400 | $26,306 | $8,232 | $18,074 |
| 2016 | $1,173 | $23,475 | $7,819 | $15,656 |
| 2015 | $1,170 | $23,475 | $7,819 | $15,656 |
| 2014 | $1,116 | $23,475 | $7,819 | $15,656 |
| 2013 | $1,183 | $24,710 | $8,232 | $16,478 |
Source: Public Records
Map
Nearby Homes
- 209 N Hill St
- 204 N Vine St
- 163 Turner Ridge Dr
- 157 Turner Ridge Dr
- 133 Turner Ridge Dr
- 135 Turner Ridge Dr
- 155 Turner Ridge Dr
- 341 N Sycamore St
- 11136 New Biddinger Rd
- 329 Miller Ct
- 331 Miller Ct
- 105 Kater Ave
- 23 Harrison Brookville Rd
- 203 S Bowles St
- 10630 New Biddinger Rd
- 10638 New Biddinger Rd
- 1105 Westfield Dr
- 10648 New Biddinger Rd
- 100 Westfield Dr
- 117 Westfield Dr
- 310 N Jefferson St
- 314 N Jefferson St
- 308 N Jefferson St
- 705 Dair Ave
- 302 N Jefferson St
- 315 N Jefferson St
- 316 N Jefferson St
- 311 N Jefferson St
- 707 Dair Ave
- 611 Dair Ave
- 609 Dair Ave
- 222 N Jefferson St
- 319 N Jefferson St
- 324 N Jefferson St
- 709 Dair Ave
- 218 N Jefferson St
- 321 N Jefferson St
- 707 Wood St
- 223 N Jefferson St
- 323 N Jefferson St