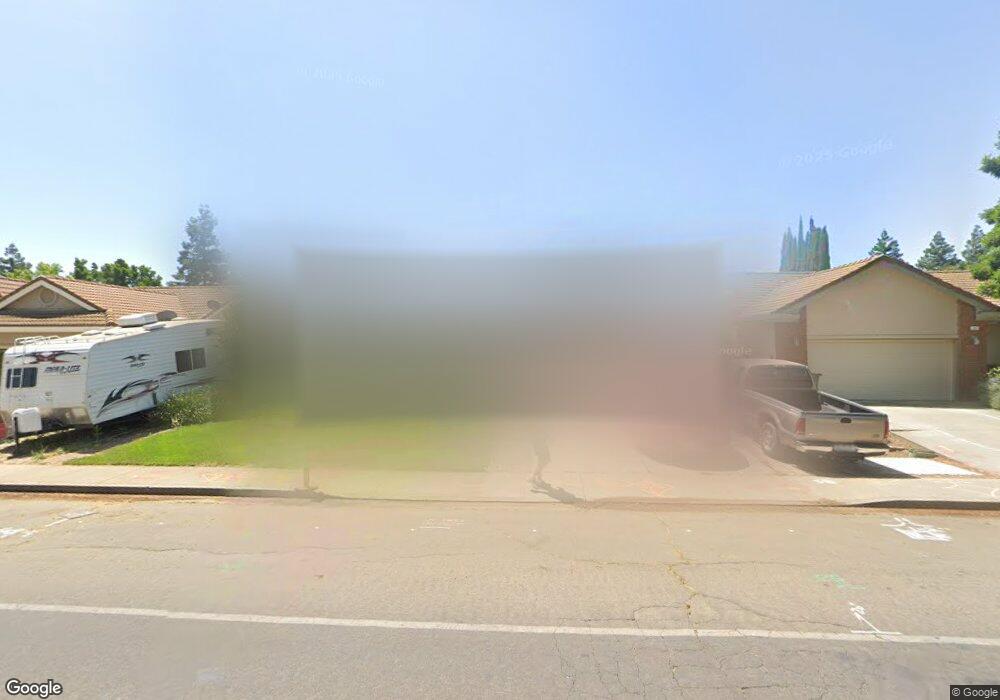
312 Niemann St Winters, CA 95694
Estimated Value: $488,000 - $667,000
4
Beds
2
Baths
2,019
Sq Ft
$296/Sq Ft
Est. Value
About This Home
This home is located at 312 Niemann St, Winters, CA 95694 and is currently estimated at $597,894, approximately $296 per square foot. 312 Niemann St is a home located in Yolo County with nearby schools including Winters Middle School and Winters High School.
Ownership History
Date
Name
Owned For
Owner Type
Purchase Details
Closed on
Jun 4, 2020
Sold by
Muldong Rudolph A and Muldong Patricia
Bought by
Muldong Rudolph A and Muldong Patricia L
Current Estimated Value
Home Financials for this Owner
Home Financials are based on the most recent Mortgage that was taken out on this home.
Original Mortgage
$318,000
Outstanding Balance
$223,552
Interest Rate
3.2%
Mortgage Type
New Conventional
Estimated Equity
$374,342
Purchase Details
Closed on
Apr 19, 2001
Sold by
Biasi Samuel and Biasi Sandra L
Bought by
Muldong Rudolph A and Muldong Patricia L
Home Financials for this Owner
Home Financials are based on the most recent Mortgage that was taken out on this home.
Original Mortgage
$195,920
Interest Rate
6.98%
Purchase Details
Closed on
Jan 27, 1994
Sold by
Biasi Sandra L and Sabo Sandra L
Bought by
Biasi Samuel and Biasi Sandra L
Home Financials for this Owner
Home Financials are based on the most recent Mortgage that was taken out on this home.
Original Mortgage
$116,750
Interest Rate
7.19%
Create a Home Valuation Report for This Property
The Home Valuation Report is an in-depth analysis detailing your home's value as well as a comparison with similar homes in the area
Home Values in the Area
Average Home Value in this Area
Purchase History
| Date | Buyer | Sale Price | Title Company |
|---|---|---|---|
| Muldong Rudolph A | -- | Placer Title Company | |
| Muldong Rudolph A | $245,000 | Chicago Title Co | |
| Biasi Samuel | -- | First American Title Co |
Source: Public Records
Mortgage History
| Date | Status | Borrower | Loan Amount |
|---|---|---|---|
| Open | Muldong Rudolph A | $318,000 | |
| Closed | Muldong Rudolph A | $195,920 | |
| Previous Owner | Biasi Samuel | $116,750 | |
| Closed | Muldong Rudolph A | $24,450 |
Source: Public Records
Tax History Compared to Growth
Tax History
| Year | Tax Paid | Tax Assessment Tax Assessment Total Assessment is a certain percentage of the fair market value that is determined by local assessors to be the total taxable value of land and additions on the property. | Land | Improvement |
|---|---|---|---|---|
| 2025 | $4,419 | $369,001 | $97,781 | $271,220 |
| 2023 | $4,419 | $354,674 | $93,985 | $260,689 |
| 2022 | $4,226 | $347,721 | $92,143 | $255,578 |
| 2021 | $4,170 | $340,904 | $90,337 | $250,567 |
| 2020 | $3,939 | $337,409 | $89,411 | $247,998 |
| 2019 | $3,942 | $330,794 | $87,658 | $243,136 |
| 2018 | $3,833 | $324,309 | $85,940 | $238,369 |
| 2017 | $3,728 | $317,951 | $84,255 | $233,696 |
| 2016 | $3,517 | $311,717 | $82,603 | $229,114 |
| 2015 | $3,419 | $307,036 | $81,363 | $225,673 |
| 2014 | $3,419 | $301,023 | $79,770 | $221,253 |
Source: Public Records
Map
Nearby Homes
- 410 Village Cir
- 805 Mermod Place
- 1103 Chapman St
- 862 W Main St
- 903 Wyatt Ln
- 758 W Main St
- 980 Degener St
- 627 Ivy Loop
- 771 Graf Way
- 623 Ivy Loop
- 0 E Baker St
- 1207 Niemann St
- 101 Abbey St
- 27643 County Road 88
- 812 Taylor St
- 0 E Grant Ave
- 204 Emery St
- 300 Creekside Way
- 0 Winters Rd Unit 325006408
- 27852 County Road 90
- 314 Niemann St
- 313 Hillview Ln
- 311 Hillview Ln
- 315 Hillview Ln
- 316 Niemann St
- 317 Hillview Ln
- 1021 Village Cir
- 318 Niemann St
- 1019 Village Cir
- 319 Hillview Ln
- 1017 Village Cir
- 1012 Village Cir
- 312 Hillview Ln
- 314 Hillview Ln
- 1015 Village Cir
- 320 Niemann St
- 321 Hillview Ln
- 316 Hillview Ln
- 1020 Hemenway St
- 1018 Hemenway St