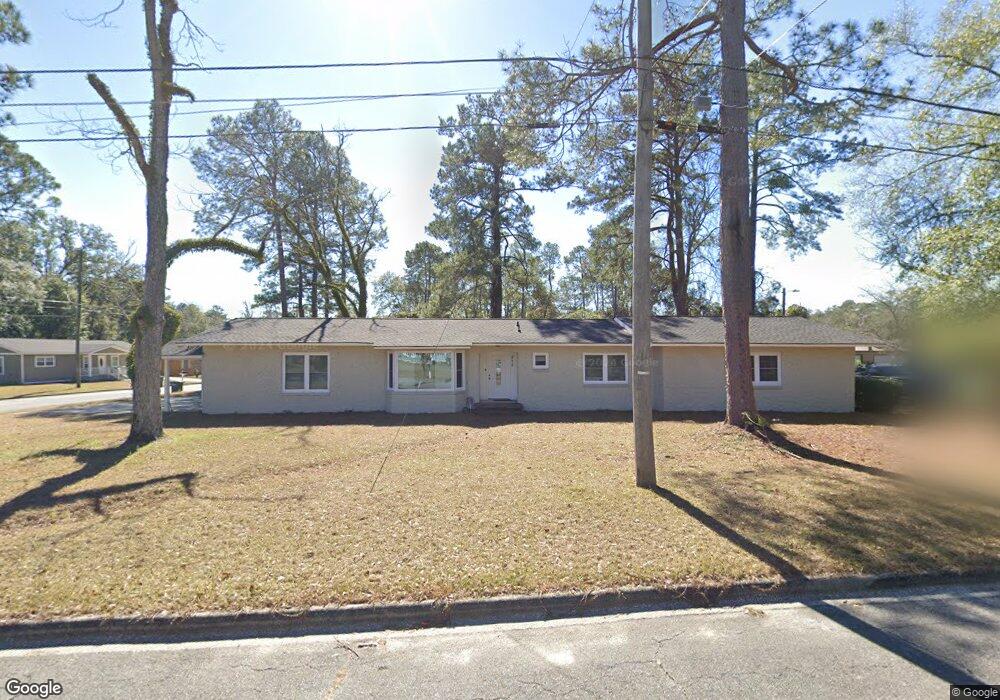
312 Plum St Thomasville, GA 31792
Estimated Value: $144,000 - $271,000
--
Bed
3
Baths
3,471
Sq Ft
$65/Sq Ft
Est. Value
About This Home
This home is located at 312 Plum St, Thomasville, GA 31792 and is currently estimated at $227,155, approximately $65 per square foot. 312 Plum St is a home located in Thomas County with nearby schools including Thomasville High School, Brookwood School, and World of Truth Christian Academy.
Ownership History
Date
Name
Owned For
Owner Type
Purchase Details
Closed on
Sep 28, 2009
Sold by
Dawson Marvin
Bought by
Ward Chad D and Ward Nicole D
Current Estimated Value
Home Financials for this Owner
Home Financials are based on the most recent Mortgage that was taken out on this home.
Original Mortgage
$160,000
Outstanding Balance
$104,584
Interest Rate
5.1%
Mortgage Type
Credit Line Revolving
Estimated Equity
$122,571
Purchase Details
Closed on
May 29, 2008
Sold by
Ward Charlie
Bought by
Dawson Marvin
Create a Home Valuation Report for This Property
The Home Valuation Report is an in-depth analysis detailing your home's value as well as a comparison with similar homes in the area
Home Values in the Area
Average Home Value in this Area
Purchase History
| Date | Buyer | Sale Price | Title Company |
|---|---|---|---|
| Ward Chad D | $100,000 | -- | |
| Dawson Marvin | -- | -- |
Source: Public Records
Mortgage History
| Date | Status | Borrower | Loan Amount |
|---|---|---|---|
| Open | Ward Chad D | $160,000 |
Source: Public Records
Tax History Compared to Growth
Tax History
| Year | Tax Paid | Tax Assessment Tax Assessment Total Assessment is a certain percentage of the fair market value that is determined by local assessors to be the total taxable value of land and additions on the property. | Land | Improvement |
|---|---|---|---|---|
| 2024 | $2,072 | $86,509 | $5,487 | $81,022 |
| 2023 | $1,989 | $80,961 | $5,487 | $75,474 |
| 2022 | $623 | $67,794 | $4,772 | $63,022 |
| 2021 | $573 | $57,287 | $4,772 | $52,515 |
| 2020 | $576 | $56,357 | $4,772 | $51,585 |
| 2019 | $581 | $56,357 | $4,772 | $51,585 |
| 2018 | $655 | $54,774 | $4,772 | $50,002 |
| 2017 | $580 | $54,548 | $4,247 | $50,301 |
| 2016 | $571 | $53,706 | $4,247 | $49,459 |
| 2015 | $621 | $57,680 | $3,960 | $53,720 |
| 2014 | $613 | $56,388 | $3,960 | $52,428 |
| 2013 | -- | $56,388 | $3,960 | $52,428 |
Source: Public Records
Map
Nearby Homes