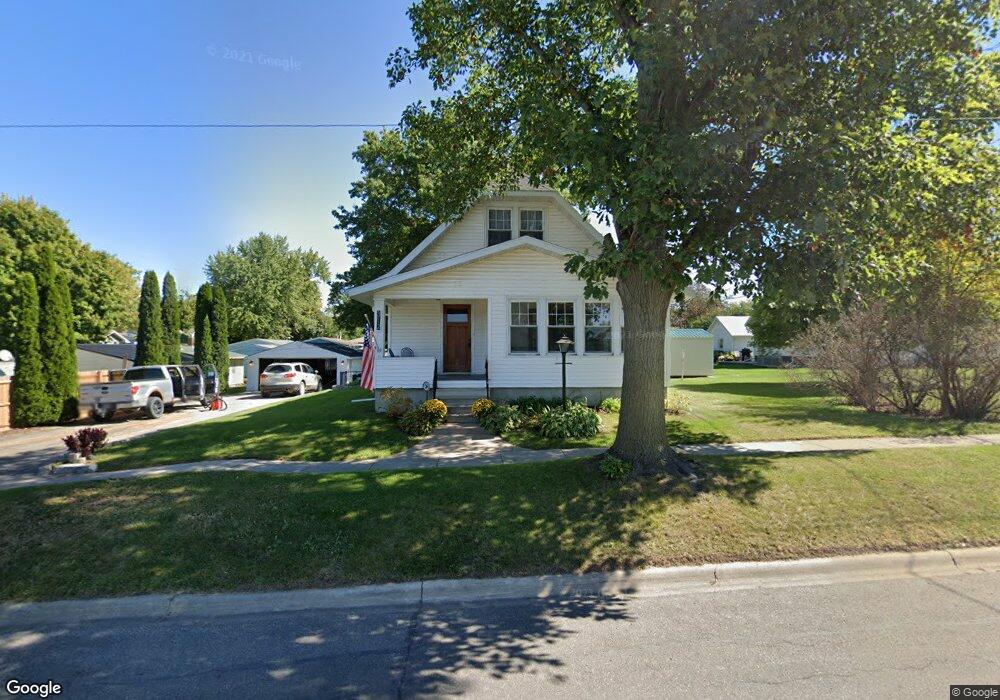
312 S 9th Ave Vinton, IA 52349
Estimated Value: $165,136 - $208,000
3
Beds
2
Baths
1,719
Sq Ft
$107/Sq Ft
Est. Value
About This Home
This home is located at 312 S 9th Ave, Vinton, IA 52349 and is currently estimated at $184,534, approximately $107 per square foot. 312 S 9th Ave is a home located in Benton County with nearby schools including Tilford Elementary School, Vinton-Shellsburg Middle School, and Vinton-Shellsburg High School.
Ownership History
Date
Name
Owned For
Owner Type
Purchase Details
Closed on
Nov 26, 2013
Sold by
Voss Shawn M and Voss Tessa
Bought by
Ingham Jon K
Current Estimated Value
Home Financials for this Owner
Home Financials are based on the most recent Mortgage that was taken out on this home.
Original Mortgage
$100,152
Outstanding Balance
$74,895
Interest Rate
4.3%
Mortgage Type
FHA
Estimated Equity
$109,639
Create a Home Valuation Report for This Property
The Home Valuation Report is an in-depth analysis detailing your home's value as well as a comparison with similar homes in the area
Home Values in the Area
Average Home Value in this Area
Purchase History
| Date | Buyer | Sale Price | Title Company |
|---|---|---|---|
| Ingham Jon K | $102,000 | Security First Title Co |
Source: Public Records
Mortgage History
| Date | Status | Borrower | Loan Amount |
|---|---|---|---|
| Open | Ingham Jon K | $100,152 |
Source: Public Records
Tax History
| Year | Tax Paid | Tax Assessment Tax Assessment Total Assessment is a certain percentage of the fair market value that is determined by local assessors to be the total taxable value of land and additions on the property. | Land | Improvement |
|---|---|---|---|---|
| 2025 | $2,548 | $160,800 | $19,600 | $141,200 |
| 2024 | $2,548 | $146,200 | $19,300 | $126,900 |
| 2023 | $2,344 | $146,200 | $19,300 | $126,900 |
| 2022 | $2,404 | $117,800 | $15,400 | $102,400 |
| 2021 | $2,404 | $117,800 | $15,400 | $102,400 |
| 2020 | $2,406 | $120,000 | $12,600 | $107,400 |
| 2019 | $2,328 | $120,000 | $12,600 | $107,400 |
| 2018 | $2,256 | $114,700 | $12,000 | $102,700 |
| 2017 | $2,164 | $114,700 | $12,000 | $102,700 |
| 2016 | $2,126 | $107,200 | $11,200 | $96,000 |
| 2015 | $2,126 | $107,200 | $11,200 | $96,000 |
| 2014 | $1,960 | $99,300 | $0 | $0 |
Source: Public Records
Map
Nearby Homes