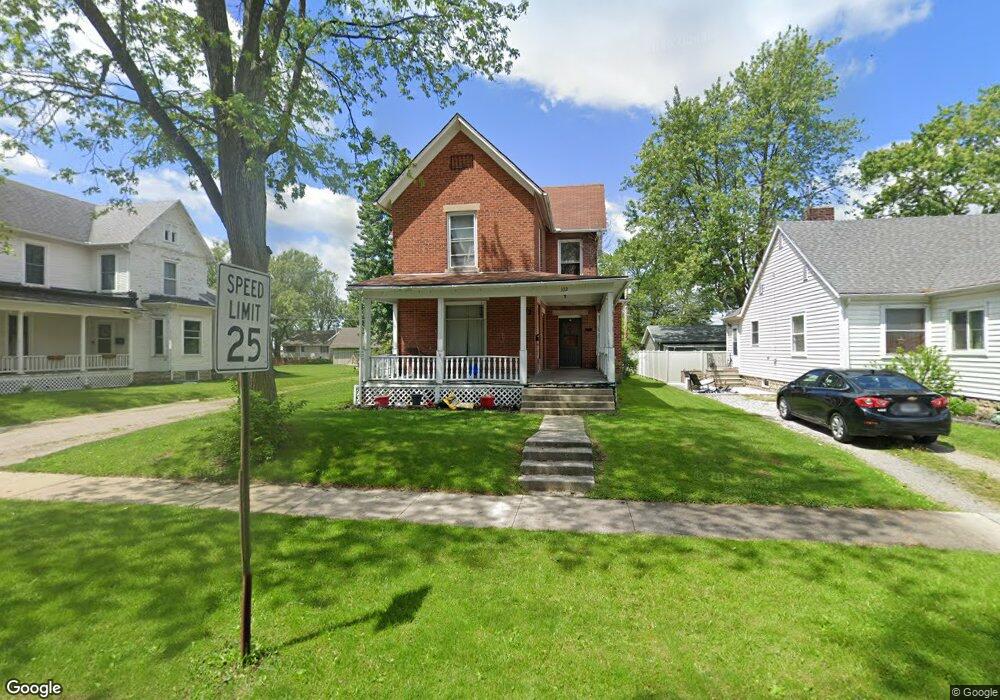
312 S Williams St Paulding, OH 45879
Estimated Value: $137,601 - $171,000
3
Beds
2
Baths
1,778
Sq Ft
$87/Sq Ft
Est. Value
About This Home
This home is located at 312 S Williams St, Paulding, OH 45879 and is currently estimated at $153,900, approximately $86 per square foot. 312 S Williams St is a home located in Paulding County with nearby schools including Paulding High School.
Ownership History
Date
Name
Owned For
Owner Type
Purchase Details
Closed on
Jun 27, 2012
Sold by
Hickman Jeffrey B and Hickman Rebecca A
Bought by
Erford Tyanna L
Current Estimated Value
Home Financials for this Owner
Home Financials are based on the most recent Mortgage that was taken out on this home.
Original Mortgage
$73,469
Outstanding Balance
$50,043
Interest Rate
3.77%
Mortgage Type
New Conventional
Estimated Equity
$103,857
Purchase Details
Closed on
Aug 28, 2009
Sold by
Lane Ron and Lane Donna
Bought by
Hickman Jeffrey B and Hickman Rebecca A
Home Financials for this Owner
Home Financials are based on the most recent Mortgage that was taken out on this home.
Original Mortgage
$72,105
Interest Rate
6.17%
Mortgage Type
New Conventional
Purchase Details
Closed on
Nov 12, 1991
Bought by
Erford Tyanna L
Create a Home Valuation Report for This Property
The Home Valuation Report is an in-depth analysis detailing your home's value as well as a comparison with similar homes in the area
Home Values in the Area
Average Home Value in this Area
Purchase History
| Date | Buyer | Sale Price | Title Company |
|---|---|---|---|
| Erford Tyanna L | $72,000 | None Available | |
| Hickman Jeffrey B | -- | None Available | |
| Hickman Jeffrey B | $75,900 | None Available | |
| Erford Tyanna L | $26,000 | -- |
Source: Public Records
Mortgage History
| Date | Status | Borrower | Loan Amount |
|---|---|---|---|
| Open | Hickman Jeffrey B | $73,469 | |
| Closed | Erford Tyanna L | $73,469 | |
| Previous Owner | Hickman Jeffrey B | $72,105 |
Source: Public Records
Tax History
| Year | Tax Paid | Tax Assessment Tax Assessment Total Assessment is a certain percentage of the fair market value that is determined by local assessors to be the total taxable value of land and additions on the property. | Land | Improvement |
|---|---|---|---|---|
| 2025 | $1,892 | $42,880 | $5,430 | $37,450 |
| 2024 | $1,892 | $34,860 | $4,410 | $30,450 |
| 2023 | $1,598 | $34,860 | $4,410 | $30,450 |
| 2022 | $1,553 | $34,860 | $4,410 | $30,450 |
| 2021 | $1,295 | $25,910 | $3,960 | $21,950 |
| 2020 | $1,163 | $25,910 | $3,960 | $21,950 |
| 2019 | $1,173 | $23,910 | $3,960 | $19,950 |
| 2018 | $1,102 | $23,910 | $3,960 | $19,950 |
| 2017 | $1,103 | $23,910 | $3,960 | $19,950 |
| 2016 | $1,104 | $23,910 | $3,960 | $19,950 |
| 2015 | $755 | $16,600 | $3,960 | $12,640 |
| 2014 | $752 | $16,600 | $3,960 | $12,640 |
| 2013 | $846 | $17,260 | $3,960 | $13,300 |
Source: Public Records
Map
Nearby Homes
- 111 W Wayne St
- 200 German St
- 520 W Wayne St
- 301 N Main St
- 406 N Cherry St
- 701 E Wayne St
- 714 W Wayne St
- 717 W Harrison St
- 215 N Dewitt St
- 516 N Williams St
- 742 E Perry St
- 780 W Jackson St
- 713 N Walnut St
- 741 Tom Tim Dr
- 830 N Walnut St
- 12035 Royer Ave
- 1118 Emerald Rd
- 11051 Road 93
- 9881 Road 180
- 0 Road 72
- 318 S Williams St
- 306 S Williams St
- 320 S Williams St
- 309 S Cherry St
- 315 S Cherry St
- 115 W Wayne St
- 311 S Williams St
- 334 S Williams St
- 121 W Wayne St
- 317 S Williams St
- 335 S Williams St
- 220 S Williams St
- 114 W Wayne St
- 111 E Wayne St
- 308 S Cherry St
- 310 S Cherry St
- 348 S Williams St
- 221 S Williams St
- 203 W Wayne St
- 345 S Williams St
Your Personal Tour Guide
Ask me questions while you tour the home.