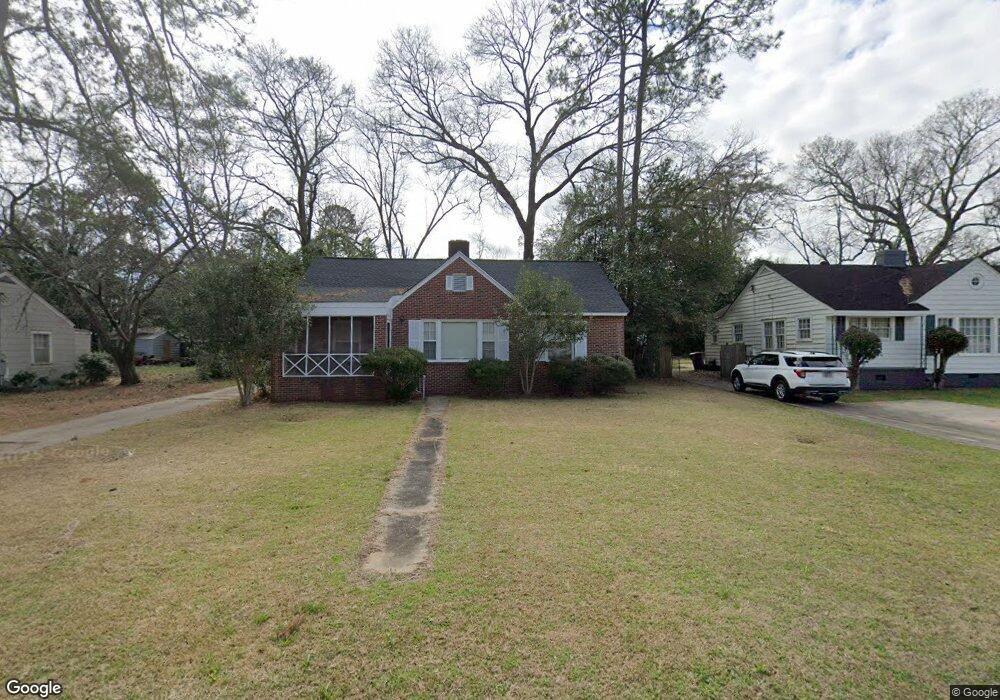
312 W Glessner St Americus, GA 31709
Estimated Value: $109,372 - $146,000
3
Beds
1
Bath
1,212
Sq Ft
$104/Sq Ft
Est. Value
About This Home
This home is located at 312 W Glessner St, Americus, GA 31709 and is currently estimated at $126,593, approximately $104 per square foot. 312 W Glessner St is a home located in Sumter County with nearby schools including Sumter County Primary School, Sumter County Elementary School, and Sumter County Middle School.
Ownership History
Date
Name
Owned For
Owner Type
Purchase Details
Closed on
Nov 28, 2006
Sold by
Wade Christopher Lee
Bought by
Pennymon Clarissa L
Current Estimated Value
Home Financials for this Owner
Home Financials are based on the most recent Mortgage that was taken out on this home.
Original Mortgage
$81,259
Outstanding Balance
$47,276
Interest Rate
6.29%
Mortgage Type
New Conventional
Estimated Equity
$79,317
Purchase Details
Closed on
Aug 24, 2001
Sold by
Kirk Bobby and Kirk Peggy
Bought by
Wade Christopher Lee
Purchase Details
Closed on
May 17, 2001
Sold by
Bass Caroll L
Bought by
Kirk Bobby
Purchase Details
Closed on
Aug 30, 2000
Sold by
Bailey Ruby R Mrs
Bought by
Bass Caroll L
Purchase Details
Closed on
Oct 1, 1949
Bought by
Bailey Ruby R Mrs
Create a Home Valuation Report for This Property
The Home Valuation Report is an in-depth analysis detailing your home's value as well as a comparison with similar homes in the area
Purchase History
| Date | Buyer | Sale Price | Title Company |
|---|---|---|---|
| Pennymon Clarissa L | $85,000 | -- | |
| Wade Christopher Lee | $68,500 | -- | |
| Kirk Bobby | $42,000 | -- | |
| Bass Caroll L | -- | -- | |
| Bailey Ruby R Mrs | -- | -- |
Source: Public Records
Mortgage History
| Date | Status | Borrower | Loan Amount |
|---|---|---|---|
| Open | Pennymon Clarissa L | $81,259 | |
| Closed | Pennymon Clarissa L | $0 |
Source: Public Records
Tax History
| Year | Tax Paid | Tax Assessment Tax Assessment Total Assessment is a certain percentage of the fair market value that is determined by local assessors to be the total taxable value of land and additions on the property. | Land | Improvement |
|---|---|---|---|---|
| 2025 | $1,166 | $27,240 | $3,160 | $24,080 |
| 2024 | $1,166 | $27,240 | $3,160 | $24,080 |
| 2023 | $1,141 | $27,240 | $3,160 | $24,080 |
| 2022 | $763 | $27,240 | $3,160 | $24,080 |
| 2021 | $1,143 | $27,240 | $3,160 | $24,080 |
| 2020 | $1,170 | $27,240 | $3,160 | $24,080 |
| 2019 | $1,241 | $27,240 | $3,160 | $24,080 |
| 2018 | $794 | $27,240 | $3,160 | $24,080 |
| 2017 | $794 | $27,240 | $3,160 | $24,080 |
| 2016 | $1,141 | $27,240 | $3,160 | $24,080 |
| 2015 | $913 | $31,840 | $3,160 | $28,680 |
| 2014 | $915 | $31,840 | $3,160 | $28,680 |
| 2013 | -- | $31,840 | $3,160 | $28,680 |
Source: Public Records
Map
Nearby Homes
- 1202 S Lee St
- 1105 Elm Ave
- TBD Grande Ave
- 104 Westlake Cir
- 633 S Hampton St
- 533 Harrold Ave
- 423 E Hill St
- 522 S Lee St
- 501 S Lee St
- 518 E Furlow St
- 406 S Hampton St
- 316 Taylor St
- 501 Varsity Dr
- 620 E Furlow St
- 305 E Church St
- 310 Wildwood Cir
- 211 Horne St
- 621 E Church St
- 108 Springfield Ave
- 219 Murphy Mill Rd
- 314 W Glessner St
- 306 W Glessner St
- 304 W Glessner St
- 316 W Glessner St
- 305 Judy Ln
- 309 Judy Ln
- 303 W Glessner St
- 313 W Glessner St
- 303 Judy Ln
- 318 W Glessner St
- 311 Judy Ln
- 302 W Glessner St
- 301 W Glessner St
- 311 W Glessner St
- 313 Judy Ln
- 320 W Glessner St
- 301 Judy Ln
- 1109 Turner St
- 315 W Glessner St
- 210 W Glessner St
Your Personal Tour Guide
Ask me questions while you tour the home.