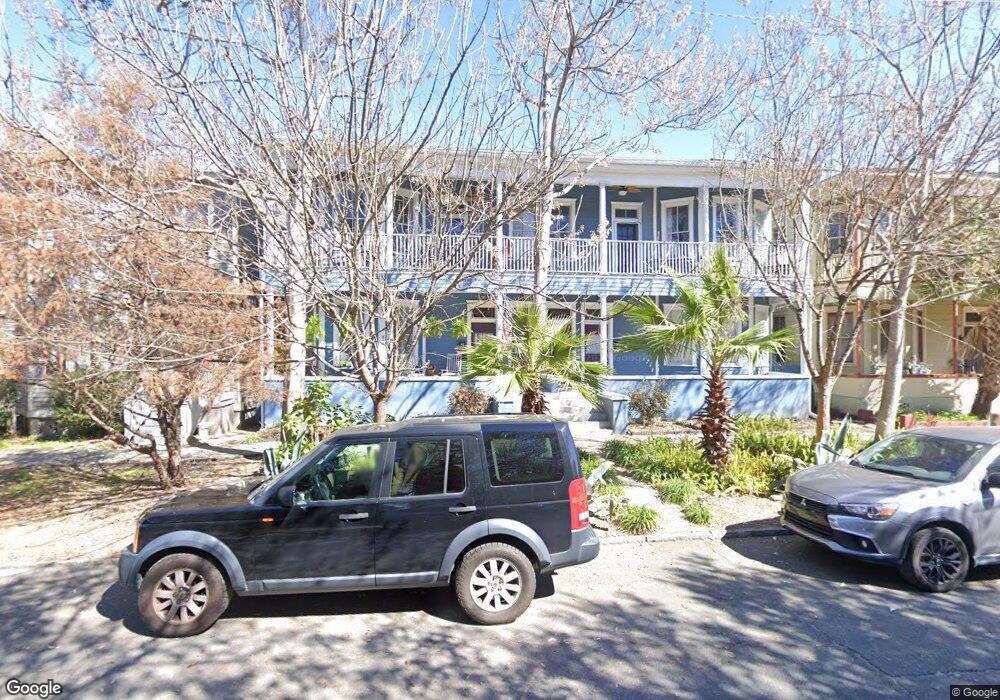
312 W Hall St Savannah, GA 31401
Historic Savannah NeighborhoodEstimated Value: $473,000 - $658,000
2
Beds
2
Baths
1,246
Sq Ft
$436/Sq Ft
Est. Value
About This Home
This home is located at 312 W Hall St, Savannah, GA 31401 and is currently estimated at $543,641, approximately $436 per square foot. 312 W Hall St is a home located in Chatham County with nearby schools including Gadsden Elementary School, Derenne Middle School, and Savannah Arts Academy.
Ownership History
Date
Name
Owned For
Owner Type
Purchase Details
Closed on
Mar 3, 2025
Sold by
Clauer Daniel George
Bought by
Angulo Gina B and Angulo Geoffrey C
Current Estimated Value
Purchase Details
Closed on
Mar 24, 2021
Sold by
Obrophy Barbara L
Bought by
Clauer Daniel George
Home Financials for this Owner
Home Financials are based on the most recent Mortgage that was taken out on this home.
Original Mortgage
$252,750
Interest Rate
2.9%
Mortgage Type
New Conventional
Purchase Details
Closed on
Jun 18, 2018
Sold by
Johansen Robert J
Bought by
Obrophy-Johanse Barbara Lynne
Purchase Details
Closed on
Aug 26, 2009
Sold by
Hall Street Development Ll
Bought by
Johansen Robert J and Obrophy Barbara L
Home Financials for this Owner
Home Financials are based on the most recent Mortgage that was taken out on this home.
Original Mortgage
$115,000
Interest Rate
5.19%
Mortgage Type
Commercial
Purchase Details
Closed on
Dec 22, 2006
Bought by
Johansen
Create a Home Valuation Report for This Property
The Home Valuation Report is an in-depth analysis detailing your home's value as well as a comparison with similar homes in the area
Home Values in the Area
Average Home Value in this Area
Purchase History
| Date | Buyer | Sale Price | Title Company |
|---|---|---|---|
| Angulo Gina B | $455,000 | -- | |
| Clauer Daniel George | $337,000 | -- | |
| Obrophy-Johanse Barbara Lynne | -- | -- | |
| Johansen Robert J | $154,000 | -- | |
| Johansen | -- | -- |
Source: Public Records
Mortgage History
| Date | Status | Borrower | Loan Amount |
|---|---|---|---|
| Previous Owner | Clauer Daniel George | $252,750 | |
| Previous Owner | Johansen Robert J | $115,000 |
Source: Public Records
Tax History Compared to Growth
Tax History
| Year | Tax Paid | Tax Assessment Tax Assessment Total Assessment is a certain percentage of the fair market value that is determined by local assessors to be the total taxable value of land and additions on the property. | Land | Improvement |
|---|---|---|---|---|
| 2025 | $851 | $265,760 | $57,320 | $208,440 |
| 2024 | $851 | $265,760 | $57,320 | $208,440 |
| 2023 | $1,613 | $207,440 | $57,320 | $150,120 |
| 2022 | $1,645 | $134,800 | $32,480 | $102,320 |
| 2021 | $4,308 | $141,120 | $29,920 | $111,200 |
| 2020 | $2,941 | $123,880 | $29,920 | $93,960 |
| 2019 | $4,305 | $123,880 | $29,920 | $93,960 |
| 2018 | $3,678 | $86,000 | $29,920 | $56,080 |
| 2017 | $3,399 | $86,000 | $29,920 | $56,080 |
| 2016 | $2,325 | $104,320 | $29,920 | $74,400 |
| 2015 | $2,740 | $70,120 | $0 | $70,120 |
| 2014 | $3,578 | $71,240 | $0 | $0 |
Source: Public Records
Map
Nearby Homes
- 1805 / 1807 Montgomery St
- 212 W Huntingdon St
- 612 Barnard St
- 528 Martin Luther King Junior Blvd
- 205 W Gaston St
- 216 W Gaston St
- 106 W Gwinnett St Unit 4F
- 106 W Gwinnett St Unit G3
- 114 W Bolton St
- 214 W Waldburg St
- 109 W Bolton St Unit A
- 103 W Gordon St Unit C
- 103 W Gordon St Unit B
- 431 Montgomery St Unit A
- 121 W Park Ave Unit 1
- 123 W Park Ave Unit 2
- 112 W Taylor St
- 110 W Taylor St
- 417 Whitaker St
- 415 Whitaker St
- 310 W Hall St
- 310 W Hall St Unit B
- 310 W Hall St Unit A
- 316 W Hall St Unit A
- 316 W Hall St Unit B
- 314 W Hall St
- 318 W Hall St
- 318 W Hall St Unit A
- 322 W Hall St Unit A
- W W Hall St Unit 75B
- W W Hall St Unit 7
- W W Hall St
- 621 Jefferson St
- 315 Lorch St Unit C
- 315 Lorch St Unit B
- 315 Lorch St Unit A
- 307 Lorch St
- 311 Lorch St
- 307 W Hall St
- 307 W Hall St Unit 75B