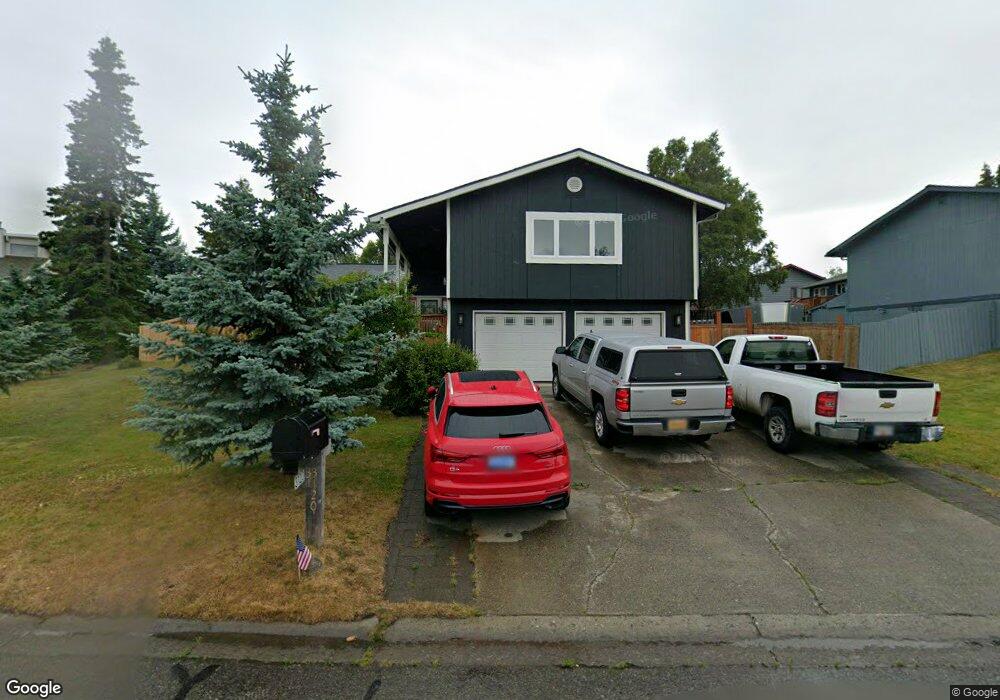
3120 Amber Bay Loop Anchorage, AK 99515
Bayshore-Klatt NeighborhoodEstimated Value: $415,000 - $554,000
4
Beds
3
Baths
1,828
Sq Ft
$272/Sq Ft
Est. Value
About This Home
This home is located at 3120 Amber Bay Loop, Anchorage, AK 99515 and is currently estimated at $496,993, approximately $271 per square foot. 3120 Amber Bay Loop is a home located in Anchorage Municipality with nearby schools including Bayshore Elementary School, Mears Middle School, and Dimond High School.
Ownership History
Date
Name
Owned For
Owner Type
Purchase Details
Closed on
Sep 13, 2018
Sold by
Riley Kathleen S
Bought by
Wilkins James
Current Estimated Value
Home Financials for this Owner
Home Financials are based on the most recent Mortgage that was taken out on this home.
Original Mortgage
$395,872
Outstanding Balance
$343,841
Interest Rate
4.6%
Mortgage Type
New Conventional
Estimated Equity
$153,152
Purchase Details
Closed on
Aug 16, 2005
Sold by
Greenough Harry W and Riley Kathleen
Bought by
Riley Kathleen
Purchase Details
Closed on
May 8, 2001
Sold by
Ahmed Magdy A and Ahmed Amy L
Bought by
Riley Kathleen
Home Financials for this Owner
Home Financials are based on the most recent Mortgage that was taken out on this home.
Original Mortgage
$139,950
Interest Rate
6.89%
Mortgage Type
Purchase Money Mortgage
Purchase Details
Closed on
May 4, 2001
Sold by
Ahmed Magdy A and Ahmed Amy L
Bought by
Riley Kathleen
Home Financials for this Owner
Home Financials are based on the most recent Mortgage that was taken out on this home.
Original Mortgage
$139,950
Interest Rate
6.89%
Mortgage Type
Purchase Money Mortgage
Purchase Details
Closed on
Apr 14, 1999
Sold by
Diaz Gabriel and Diaz Shirley P
Bought by
Greenough Harry W and Riley Kathleen S
Home Financials for this Owner
Home Financials are based on the most recent Mortgage that was taken out on this home.
Original Mortgage
$196,750
Interest Rate
7.04%
Mortgage Type
New Conventional
Create a Home Valuation Report for This Property
The Home Valuation Report is an in-depth analysis detailing your home's value as well as a comparison with similar homes in the area
Home Values in the Area
Average Home Value in this Area
Purchase History
| Date | Buyer | Sale Price | Title Company |
|---|---|---|---|
| Wilkins James | -- | None Available | |
| Riley Kathleen | -- | -- | |
| Riley Kathleen | -- | -- | |
| Riley Kathleen | -- | -- | |
| Riley Kathleen | -- | First American Title | |
| Greenough Harry W | -- | -- |
Source: Public Records
Mortgage History
| Date | Status | Borrower | Loan Amount |
|---|---|---|---|
| Open | Wilkins James | $395,872 | |
| Previous Owner | Riley Kathleen | $139,950 | |
| Previous Owner | Riley Kathleen | $139,950 | |
| Previous Owner | Greenough Harry W | $196,750 |
Source: Public Records
Tax History
| Year | Tax Paid | Tax Assessment Tax Assessment Total Assessment is a certain percentage of the fair market value that is determined by local assessors to be the total taxable value of land and additions on the property. | Land | Improvement |
|---|---|---|---|---|
| 2025 | $4,096 | $537,100 | $111,000 | $426,100 |
| 2024 | $4,096 | $328,700 | $111,000 | $217,700 |
| 2023 | $7,367 | $432,600 | $111,000 | $321,600 |
| 2022 | $6,315 | $425,000 | $111,000 | $314,000 |
| 2021 | $6,979 | $387,300 | $111,000 | $276,300 |
| 2020 | $5,653 | $382,800 | $111,000 | $271,800 |
| 2019 | $5,279 | $372,700 | $111,000 | $261,700 |
| 2018 | $5,187 | $366,300 | $111,000 | $255,300 |
| 2017 | $5,486 | $370,300 | $111,000 | $259,300 |
| 2016 | $4,848 | $375,200 | $111,000 | $264,200 |
| 2015 | $4,848 | $370,100 | $111,000 | $259,100 |
| 2014 | $4,848 | $350,200 | $111,000 | $239,200 |
Source: Public Records
Map
Nearby Homes
- 10254 Goodnews Cir
- 3121 Marathon Cir
- 10545 Vancouver Cir
- 3099 Seclusion Cove Dr Unit 24
- 10205 Goodnews Cir
- 10121 Goodnews Ln
- 3531 Amber Bay Loop
- 3511 Amber Bay Loop
- 3101 Bettles Bay Loop
- 4240 Endeavor Cir
- 3806 N Point Cir
- 2356 Leander Cir
- 10935 Northfleet Dr
- 3769 Quartz Cir
- 3864 Quartz Cir
- 3820 Runestad Cir
- 9353 Blackberry St Unit 2
- 9327 Blackberry St Unit G25
- 2741 Kingfisher Dr
- 9215 Commons Place Unit 5
- 3110 Amber Bay Loop
- 3130 Amber Bay Loop
- 3420 Perenosa Bay Dr
- 3100 Amber Bay Loop
- 3090 Amber Bay Loop
- 3430 Perenosa
- 3430 Perenosa Bay Dr
- 3080 Amber Bay Loop
- 3131 Amber Bay Loop
- 3510 Admiralty Bay Dr
- 3520 Admiralty Bay Dr
- 3401 Perenosa Bay Dr
- 3550 Admiralty Bay Dr
- 3440 Perenosa
- 3440 Perenosa Bay Dr
- 3560 Admiralty Bay Dr
- 3071 Amber Bay Loop
- 3500 Chiniak Bay Dr
- 3421 Perenosa
- 3421 Perenosa Bay Dr
Your Personal Tour Guide
Ask me questions while you tour the home.